From Zero to 1.8M Connections: A Rust/Tokio Gateway’s Real Scaling Journey
That Non-Dramatic Crash Moment
The moment the system stopped scaling linearly wasn’t dramatic at all.
CPU wasn’t pegged. Memory wasn’t exhausted. Nothing crashed. But at around 420K concurrent connections, latency curves started bending upward and never came back down. Throughput flattened. Tail latencies widened. From a mathematical perspective we had headroom, but the Tokio scheduler disagreed.
That inflection point forced us to face a reality. When things are “fast enough,” it’s easy to ignore a fact: extreme concurrency is not a performance problem, it’s a scheduling problem.
What follows is not some Rust success story. This is a postmortem about how a Tokio-based gateway behaved once it crossed from hundreds of thousands of connections into millions—where scheduler mechanics, backpressure, and observability matter more than raw efficiency.
Our Three Wrong Assumptions About Rust/Tokio Concurrency
We made three assumptions that later proved wrong.
First, as long as it’s async, tasks scale linearly with cores. Second, as long as you avoid blocking calls, cooperative scheduling basically “just works.” Third, idle connections are cheap.
The mental model that actually matters looks like this:
- Threads are fixed, scarce, scheduled preemptively by the operating system
- Tasks are cheap, numerous, scheduled cooperatively by the runtime
- Progress only happens when tasks voluntarily yield
Async everywhere doesn’t eliminate competition, it just redistributes it. When tasks stop yielding frequently—due to long polls, oversized buffers, or unexpected CPU work—the scheduler can’t enforce fairness. At scale, this becomes starvation, not slowness.
The first wall we hit wasn’t the throughput wall, it was the fairness wall.
The Tokio Gateway Architecture: What It Actually Does
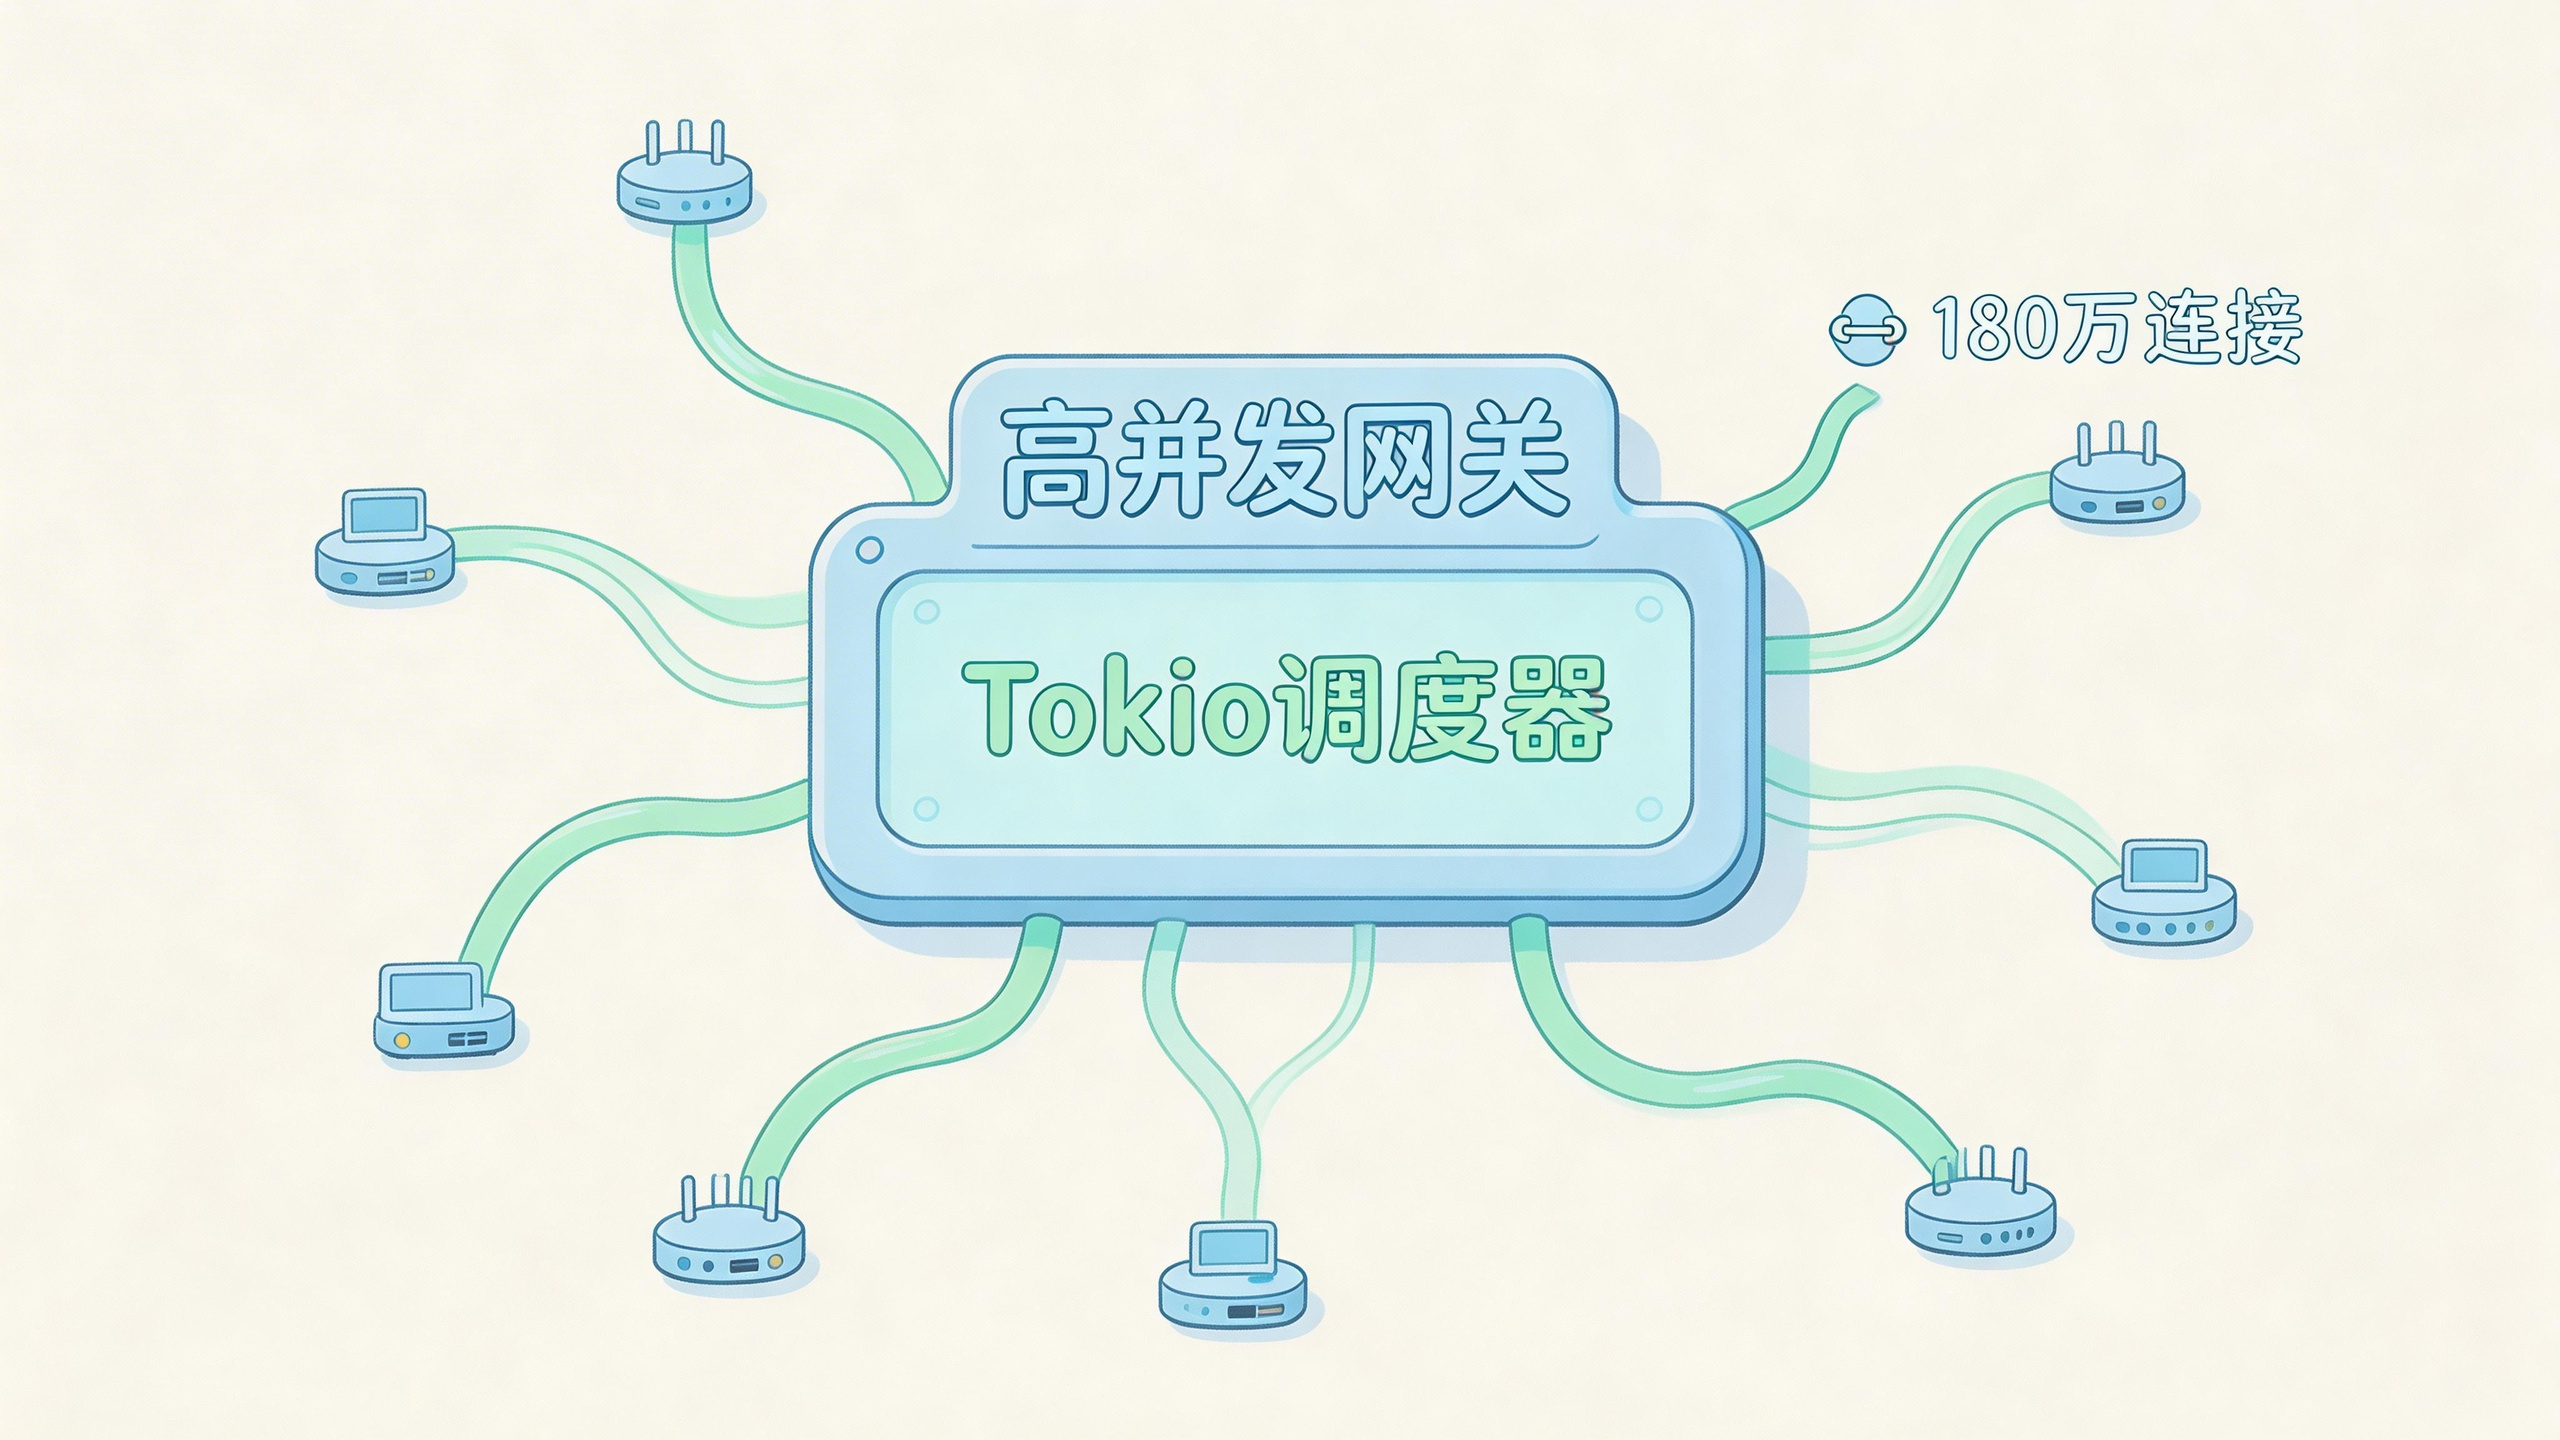
The system we’re discussing is a stateless TCP/WebSocket gateway. It terminates connections, performs lightweight authentication, then forwards framed messages to downstream services over persistent links. Most connections are idle most of the time, with burst traffic coming from fan-out events and reconnection storms.
The core loop looks simple, but the runtime structure matters more than the code itself.
[Kernel Accept Queue]
       |
  [Accept Loop]
       |
  [Connection Task]
       |
 [IO State Machine]
       |
 [Downstream Pool]
At runtime, this maps to a multi-threaded Tokio executor:
[Tokio Runtime]
  |--------|--------|
[Worker 0][Worker 1][Worker 2]
   |   |       |         |
 [Task][Task] [Task][Task] [Task]
Each connection owns exactly one task. No per-message spawning. No background helpers. Tasks park on IO and wake on readiness. This discipline is what made 1.8M connections possible.
Tokio Scheduler and Runtime Tuning in Practice
Out of the box, Tokio’s work-stealing scheduler is both aggressive and optimistic. It assumes tasks are short-lived and cooperative. Under high connection counts, these assumptions decay.
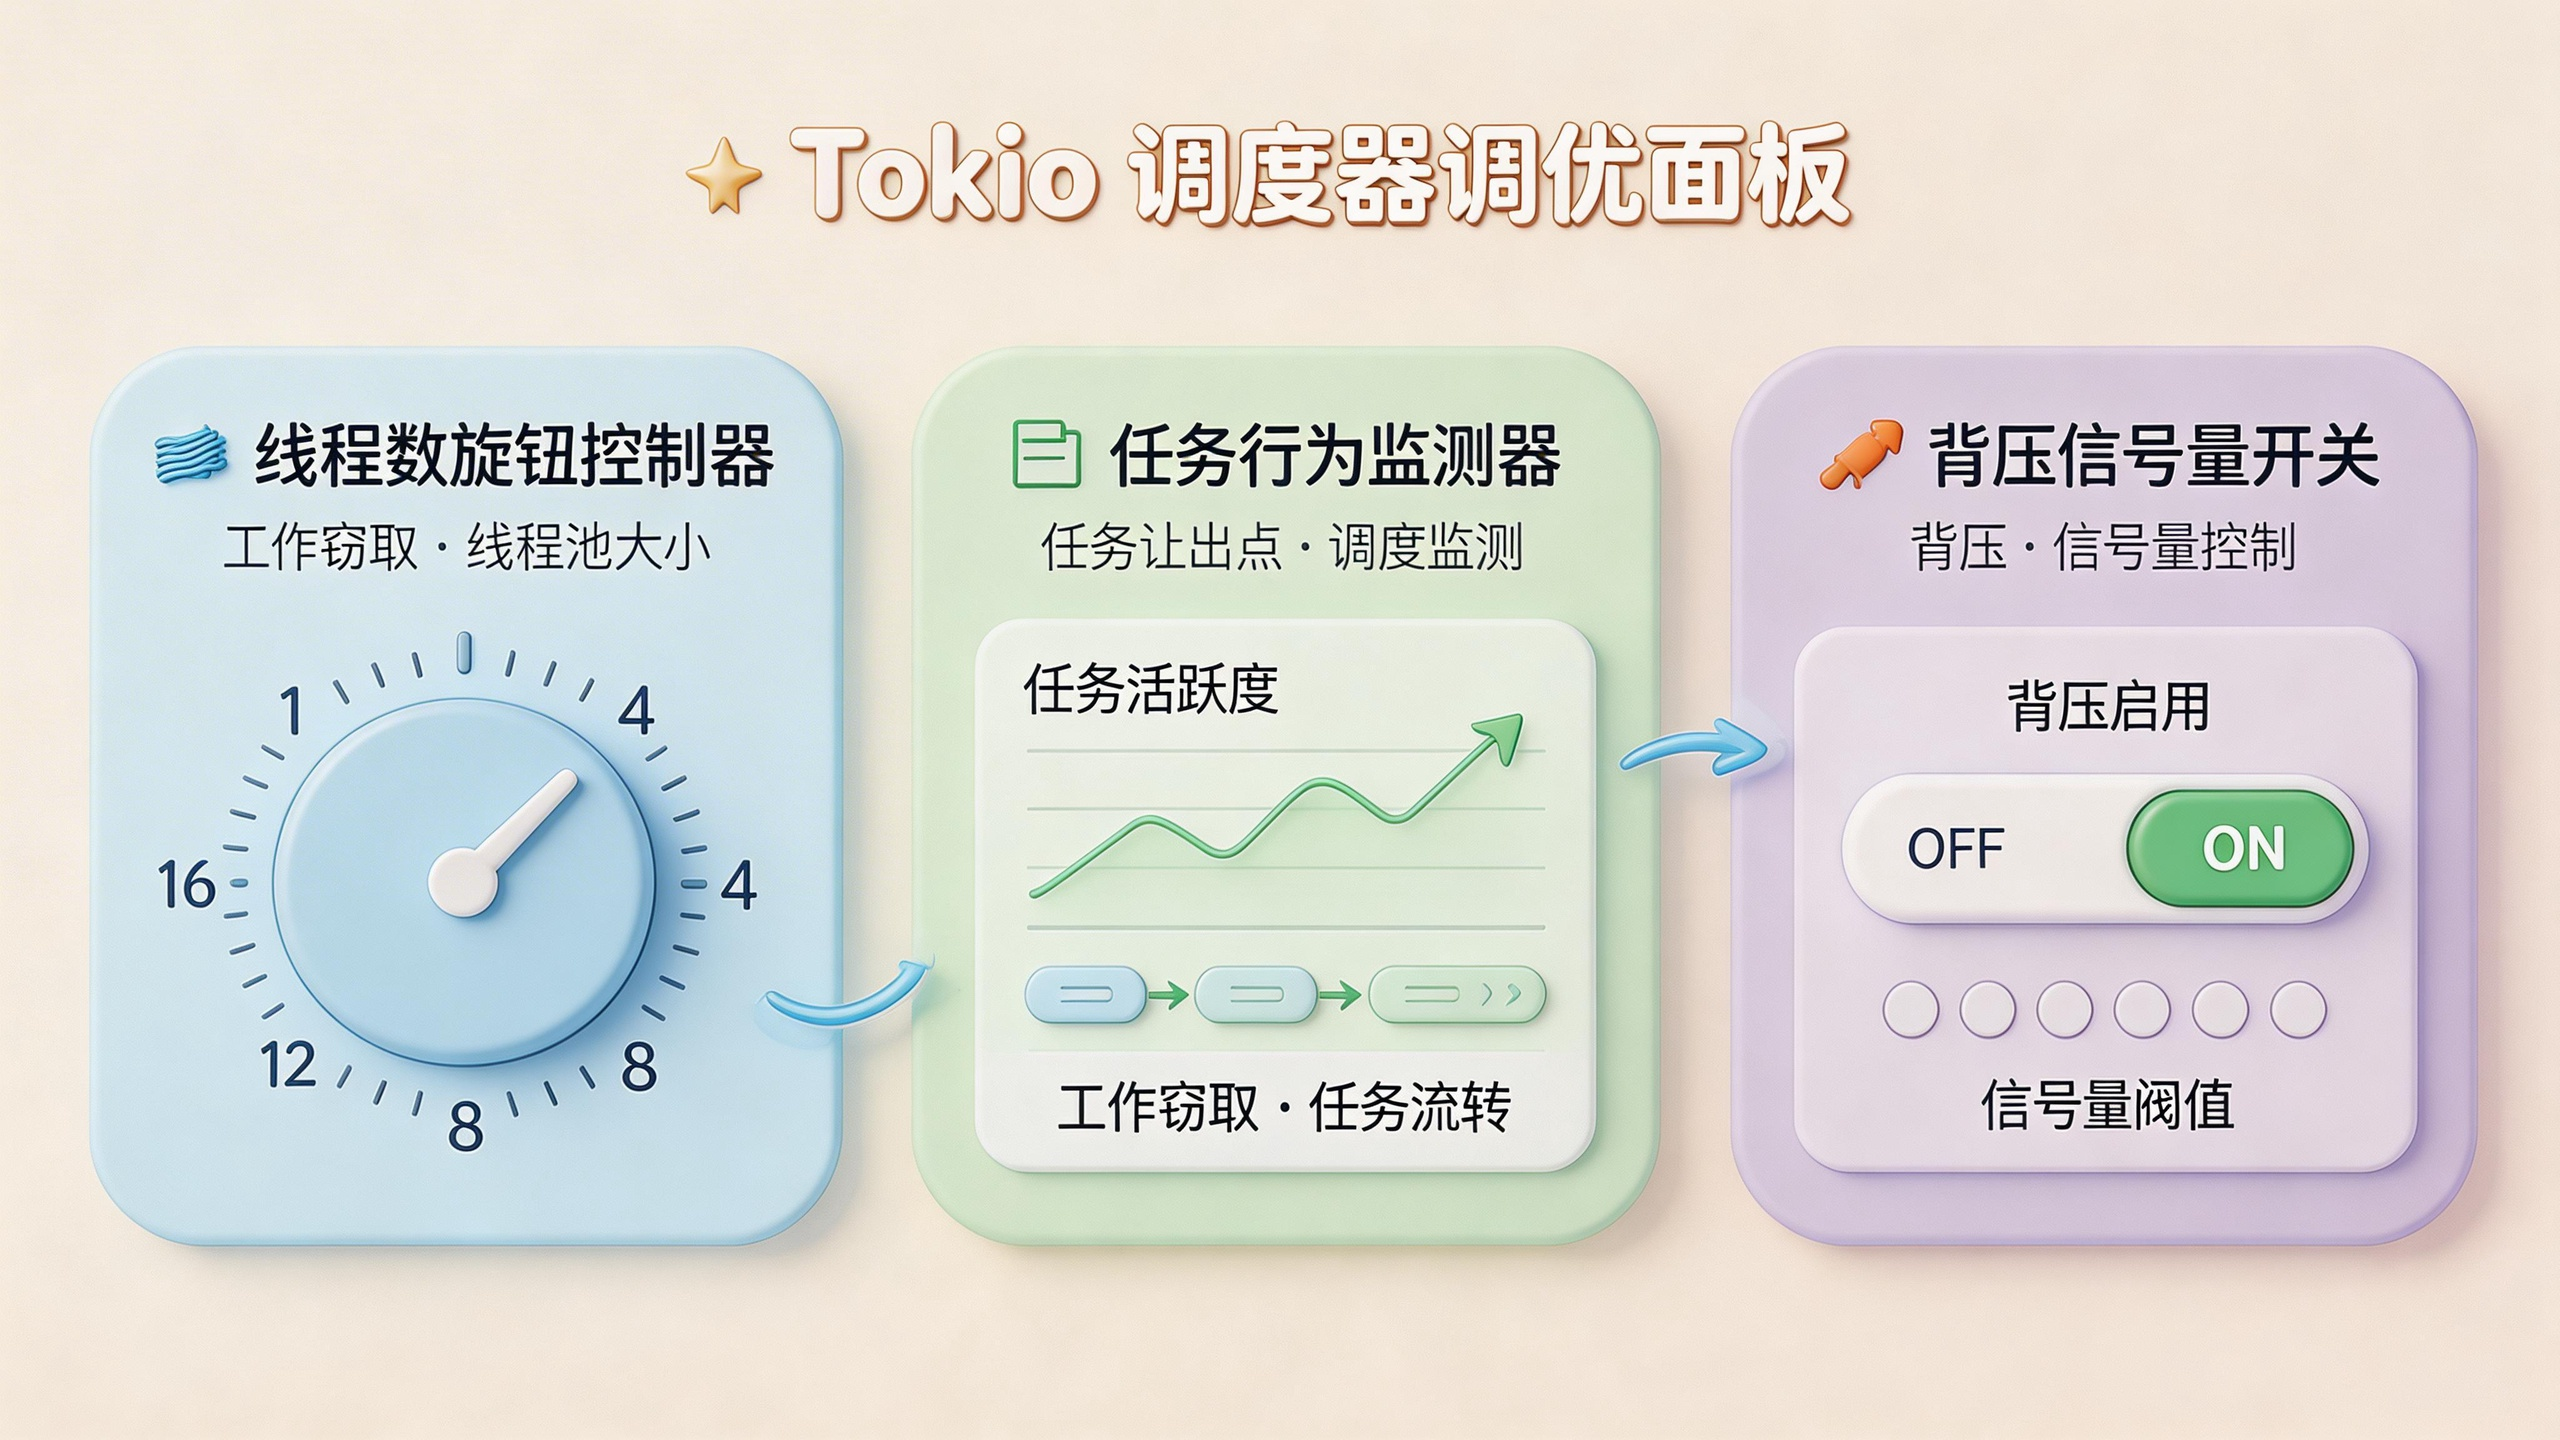
Our first tuning lever was runtime thread count. Matching threads to cores was a mistake. We found better fairness with fewer runtime threads than physical cores, reducing cross-core stealing overhead.
let rt = tokio::runtime::Builder::new_multi_thread()
    .worker_threads(12) // 16-core machine
    .enable_io()
    .enable_time()
    .build()?;
The second lever was task behavior. We audited every async function for implicit loops and long polls. Anything that could run longer than ~200 microseconds without awaiting was restructured. In practice, this meant aggressively breaking work into yield points.
The third lever was accept backpressure. Accepting connections faster than the scheduler can fairly park them is self-inflicted harm.
loop {
    let (sock, _) = listener.accept().await?;
    semaphore.acquire().await?;
    tokio::spawn(handle_conn(sock, permit));
}
The semaphore wasn’t about limiting total connections. It was about smoothing scheduler load during spikes. This alone pushed our linear scaling point past 700K connections.
The Reality of 1.8 Million Connections
“1.8 million connections” doesn’t mean 1.8 million active requests.
In our measurements:
- ~1.5M connections were idle WebSockets, heartbeat-only
- ~250K were intermittently active
- ~50K sustained steady message flow
On a 16-core, 128GB machine, memory became the primary constraint, not CPU. Each connection, including buffers and task state, averaged ~48KB. At 1.8M connections, that’s ~86GB resident memory before allocator overhead.
We never crossed 65% CPU utilization. Scheduler latency—measured as time-to-first-poll after readiness—became the limiting factor.
At ~1.9M connections, tail wake-up latency exceeded 40ms during churn events. That was our ceiling.
Observability: Rust Gateway’s Scaling Diagnostic Tool
We didn’t discover limits through benchmarks. We discovered them through scheduler signals.
The three metrics that mattered most:
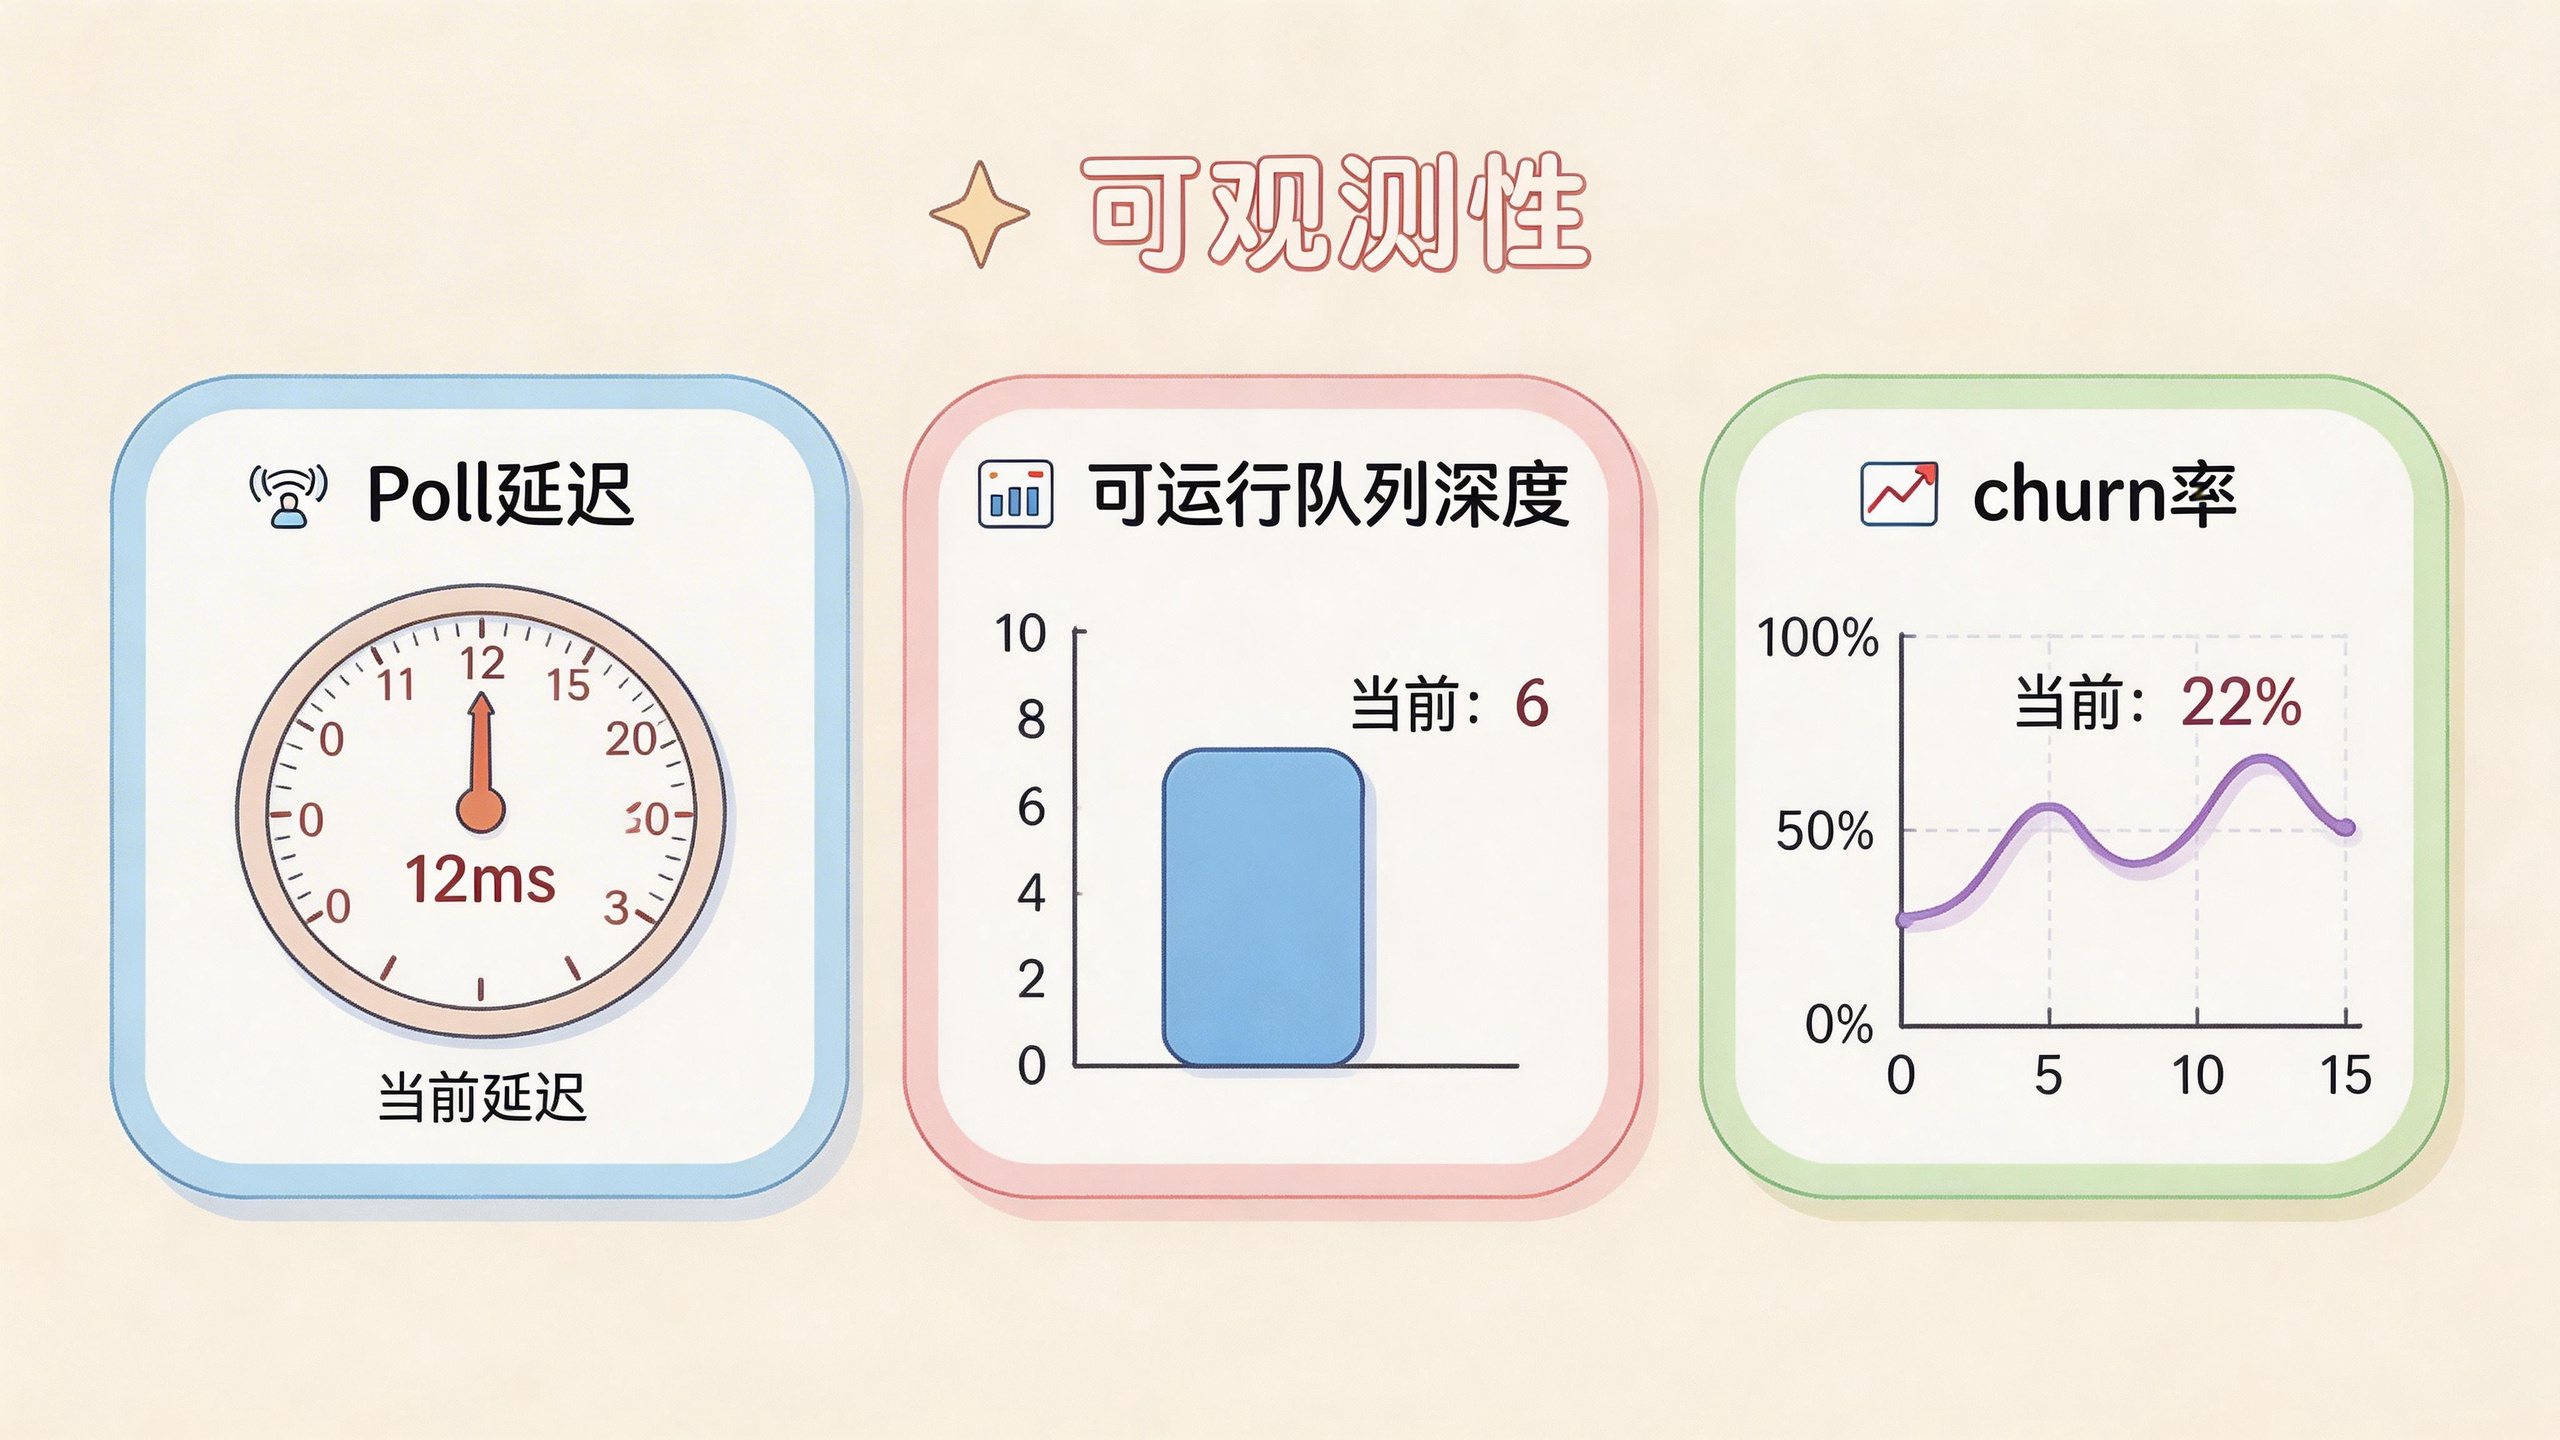
- Task poll delay (time from IO readiness to poll)
- Runnable queue depth per worker thread
- Connection churn rate (accepts + closes per second)
Example log line during saturation:
sched_poll_delay_p99=37ms runnable_tasks=182k accepts=9k/s closes=8.7k/s
Before CPU saturation, poll delay spiked first—that was the early warning. Memory pressure showed up later as allocator stalls, not OOMs.
The first thing to degrade wasn’t throughput, it was fairness.
Failure Modes and Pathological Cases
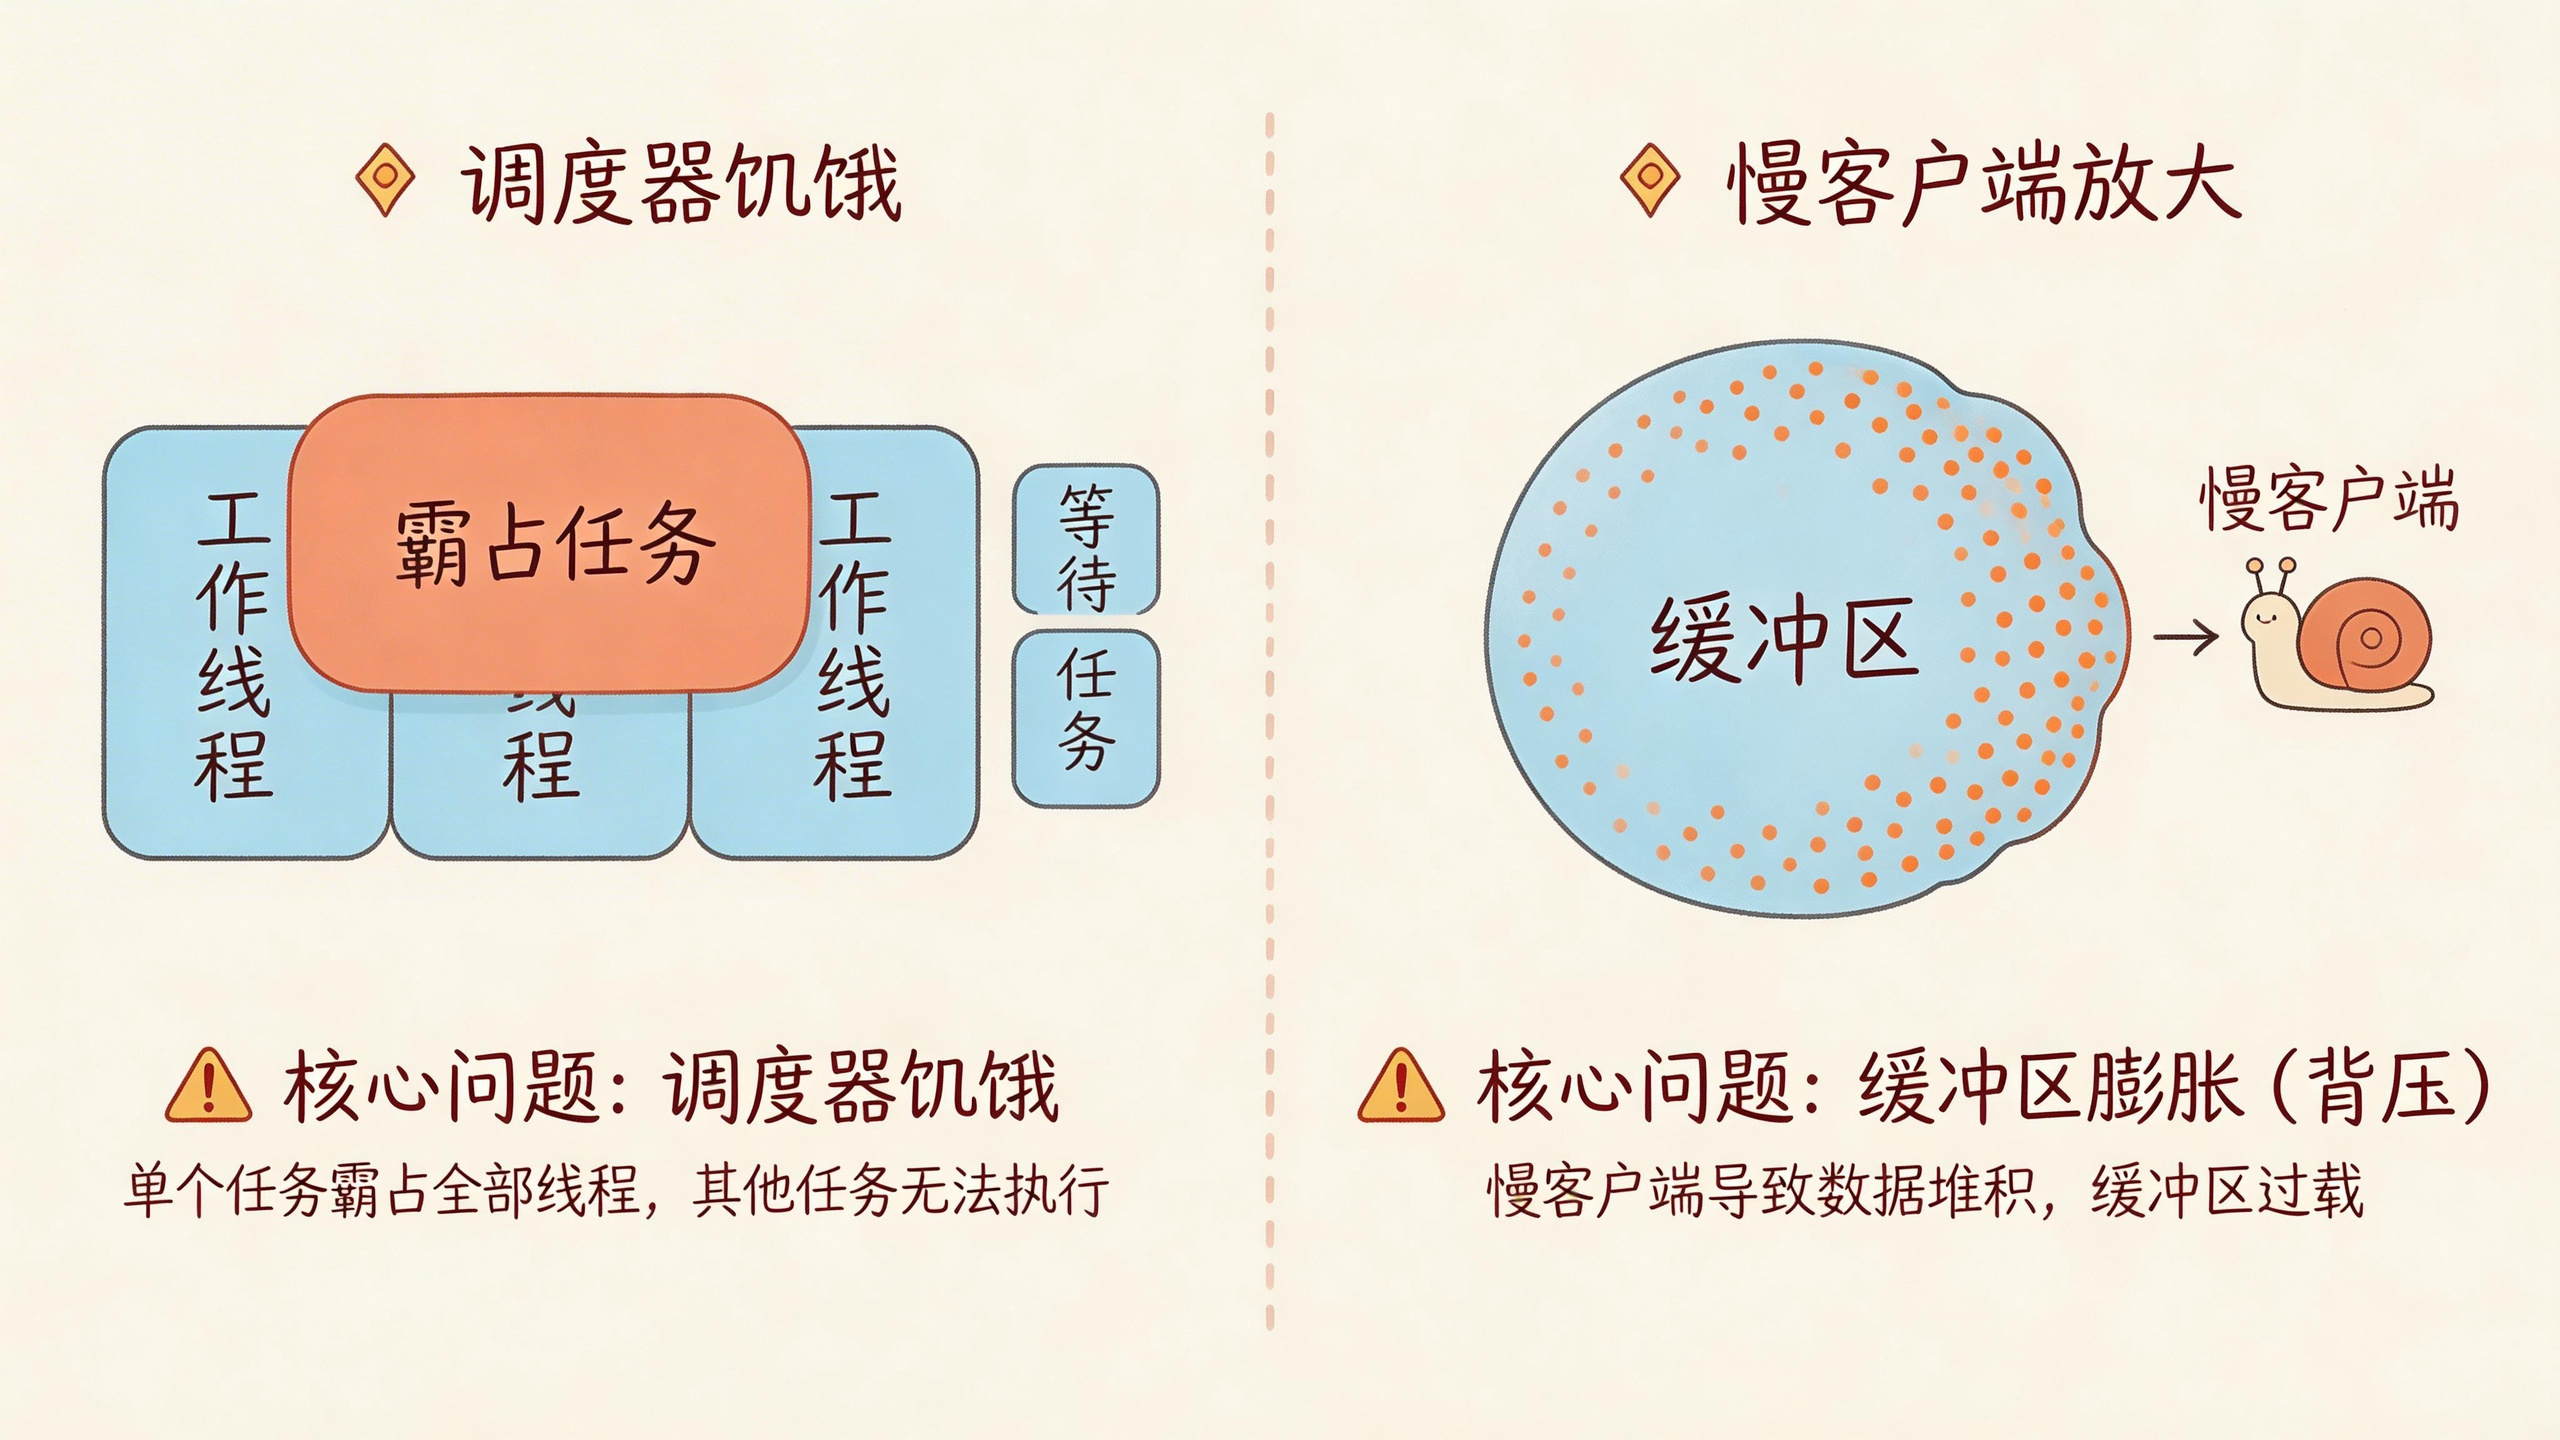
Two failure modes mattered in production.
Scheduler starvation. A small number of misbehaving tasks—usually slow downstream writes without proper backpressure—would monopolize worker threads. Detection came from asymmetric runnable queues. Mitigation was strict write timeouts and splitting IO paths.
Slow clients also cause problems. Clients that read slowly cause buffer growth and delayed yields. At scale, a few thousand slow consumers distort memory usage for everyone. We capped per-connection outbound buffers and enforced drop-on-backpressure semantics.
Neither failure looked like a crash. Both looked like “everything is still working, just worse.”
Trade-offs and Non-Goals
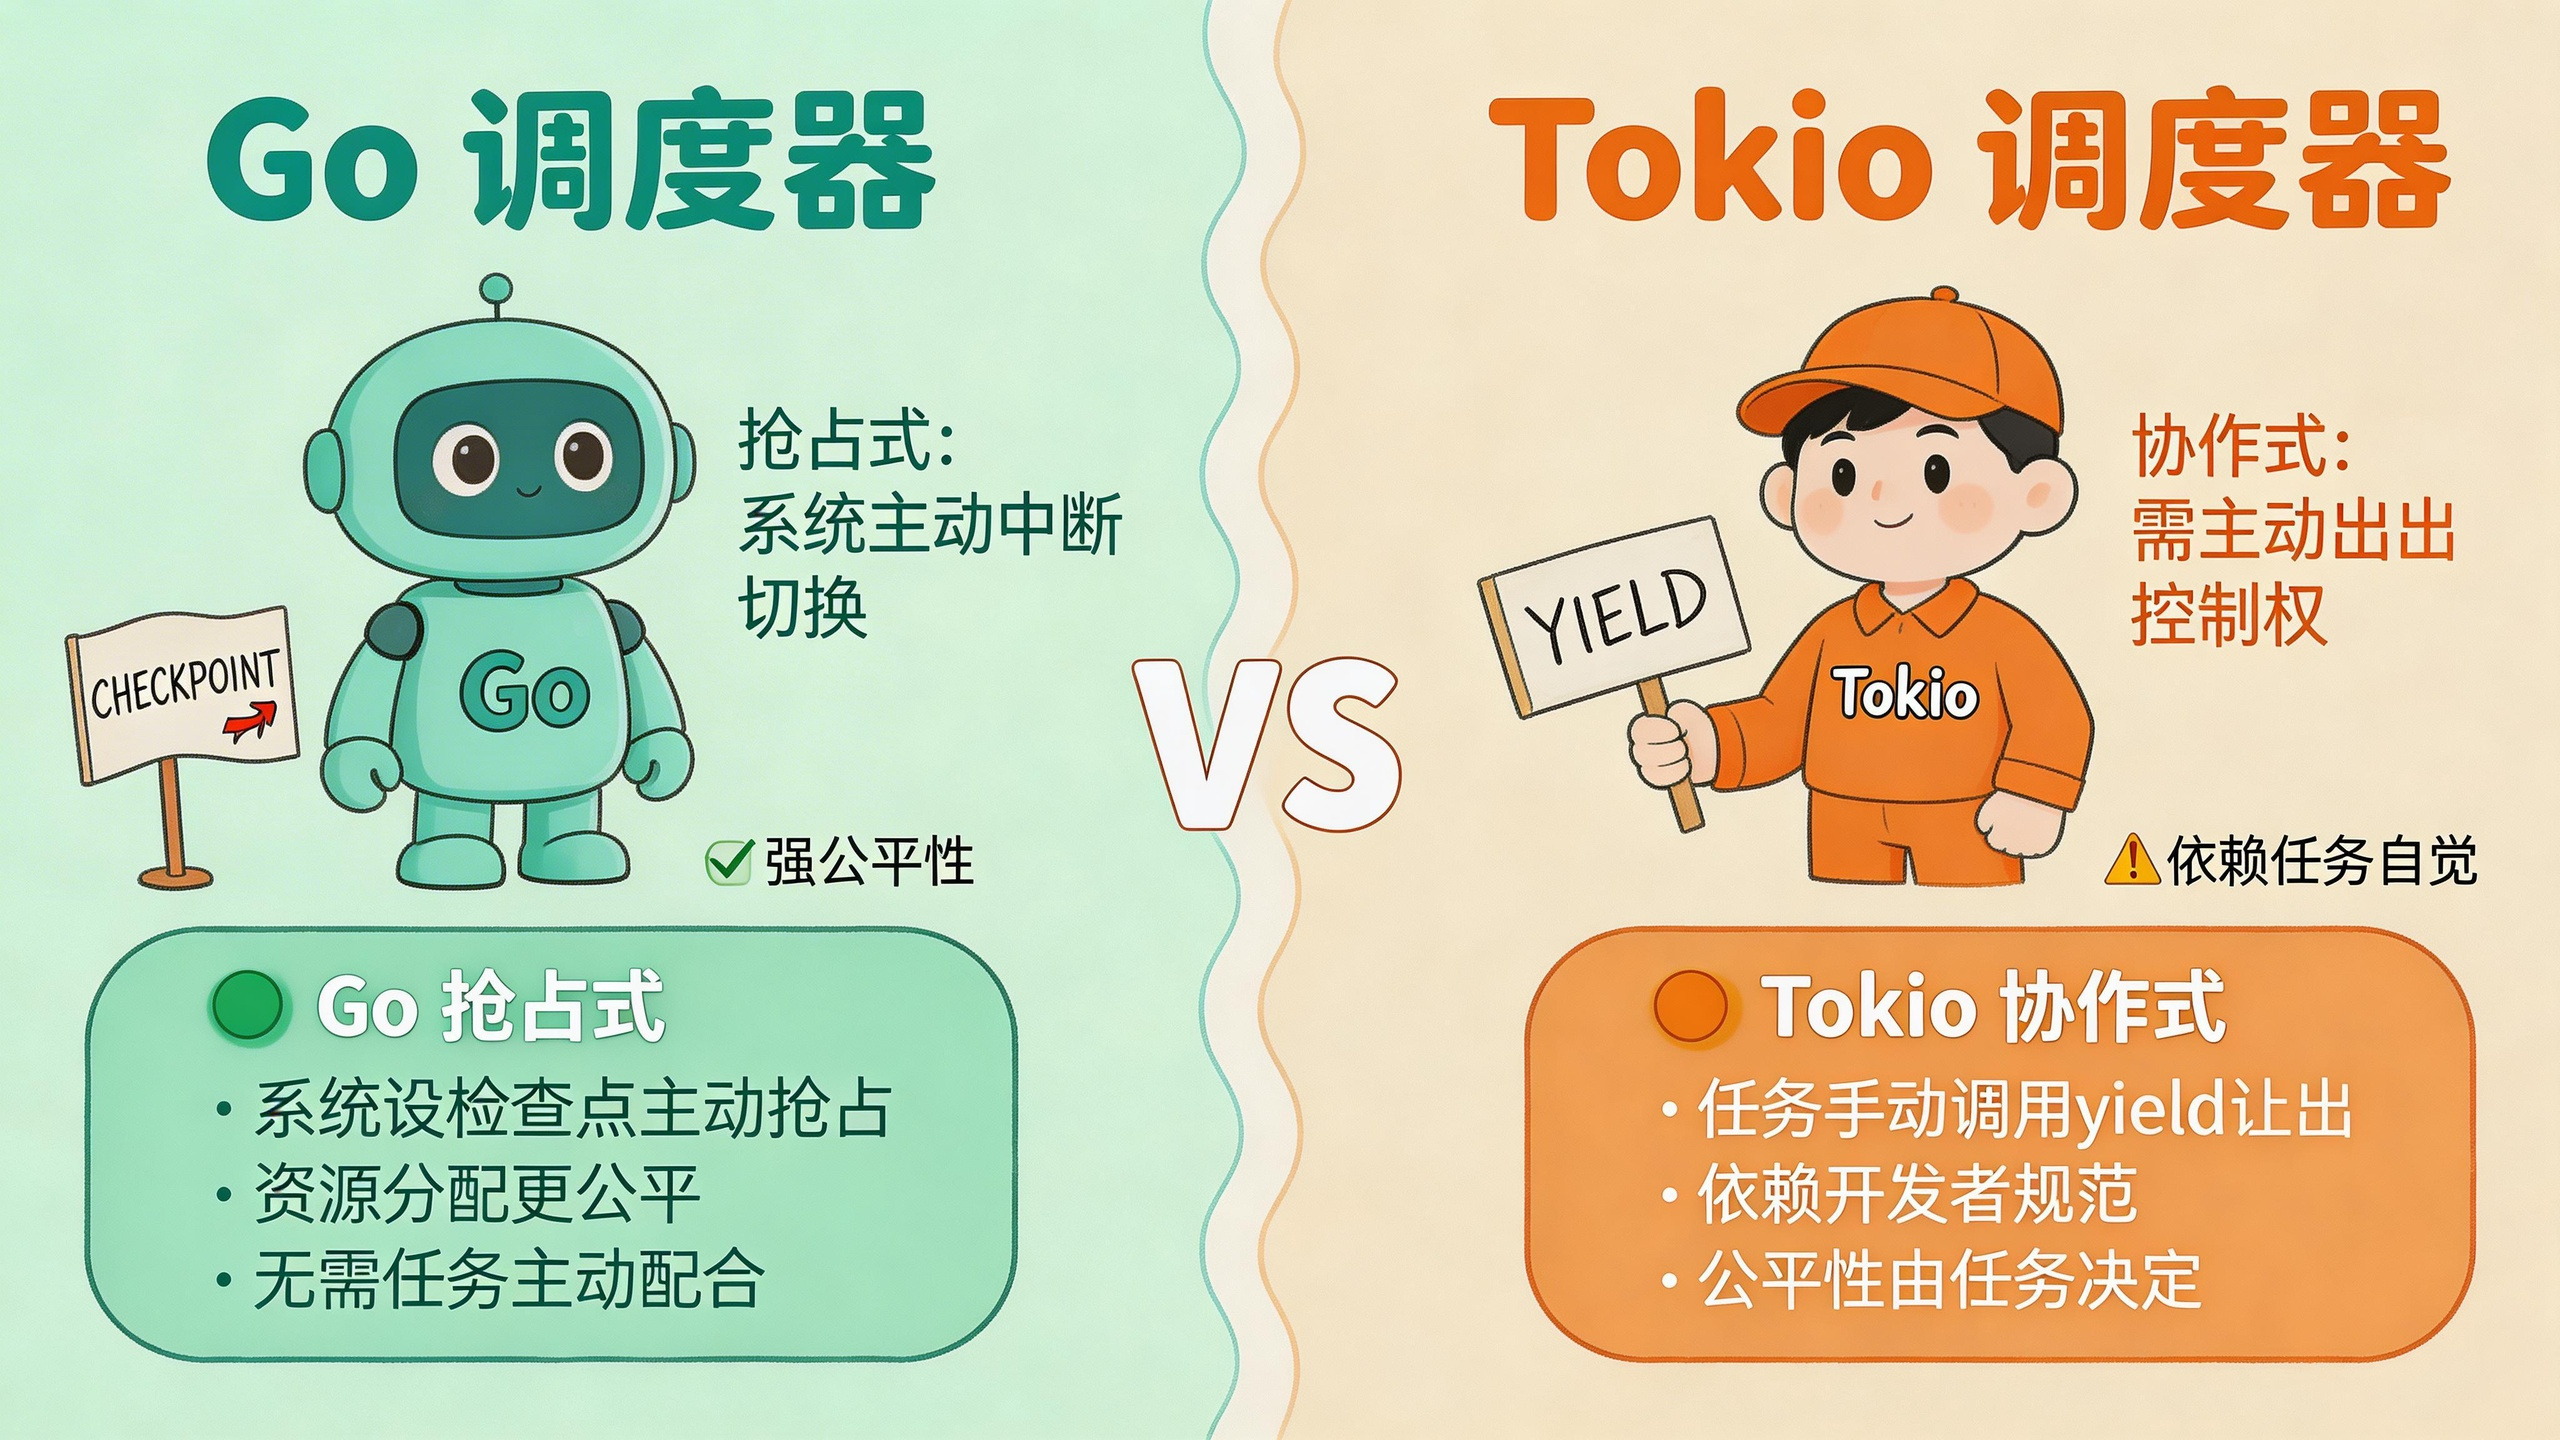
This architecture is fragile under CPU-heavy per-connection logic. Tokio’s cooperative model assumes IO dominance. If your workload mixes compute with IO, preemptive runtimes like the JVM may behave more predictably.
Go’s scheduler, while less efficient per task, requires less tuning when handling pathological fairness cases. Java’s Loom simplifies some of this at the cost of memory.
Tokio shines when tasks are honest. It punishes you when they aren’t.
Final Thoughts
We didn’t end up with some heroic system. We ended up with a system whose limits we understand.
This isn’t exactly a victory for Rust or async. It’s more like a negotiated truce with a scheduler—it will do exactly what you tell it to do, and nothing you assume.
As the old scheduler says: you tell it what to do, it does what you tell it. What you don’t say, it doesn’t do.
Frequently Asked Questions
How much memory does 1.8M connections need?
In our environment, each connection averaged ~48KB, including TCP buffers, task state, and application buffers. 1.8M connections require approximately 86GB of memory, not counting allocator overhead. Memory typically becomes the bottleneck before reaching CPU limits.
not set thread count to core count?
Tokio’s work-stealing scheduler has overhead when stealing tasks across cores. Using fewer threads than physical cores reduces this overhead and improves cache locality, thereby enhancing overall fairness. On a 16-core machine, we found 12 worker threads performed best.
What’s the difference between Tokio and Go’s schedulers?
Go’s scheduler is preemptive and inserts checkpoints at function calls. Tokio relies entirely on cooperative scheduling—tasks must voluntarily yield. This means Tokio can be more efficient, but misbehaving tasks can monopolize worker threads. Go enforces fairness; Tokio requires you to explicitly design for it.