
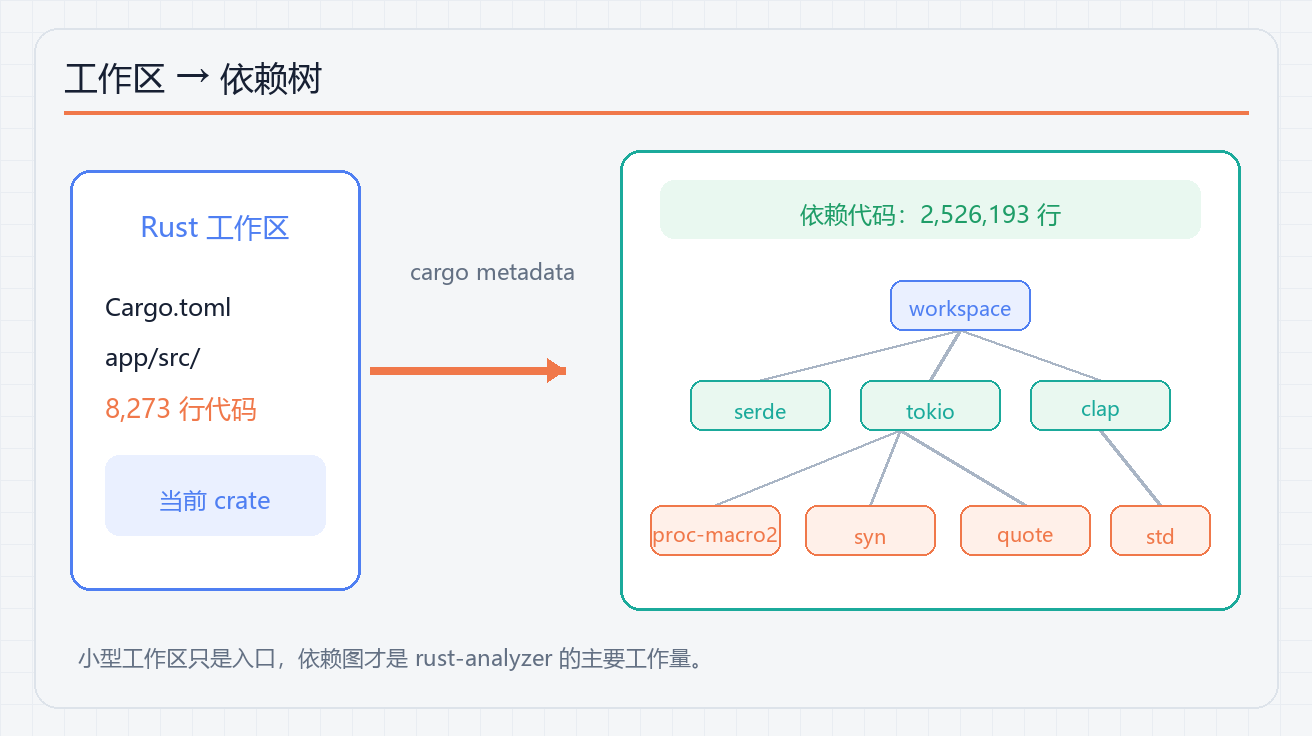
I measured a real project almost at random: the fd file-search tool. Its workspace contains 8,273 lines of project code, which is a normal size for a Rust project.
Yet rust-analyzer indexed 2,526,193 lines of dependency code to serve those 8,000 lines. The run used 1.4 GB of memory and took 17.4 seconds on a cold start.
When you write Rust, the editor is not only working on the code you wrote. It is also chewing through the dependency world behind it.
That is the root of rust-analyzer’s sluggishness: its defaults are diligent — calculate everything that might be useful — while your efficiency goal is lazy — calculate only what I need right now. The tension between those goals determines the IDE experience.
0. The short decision: measure before disabling features
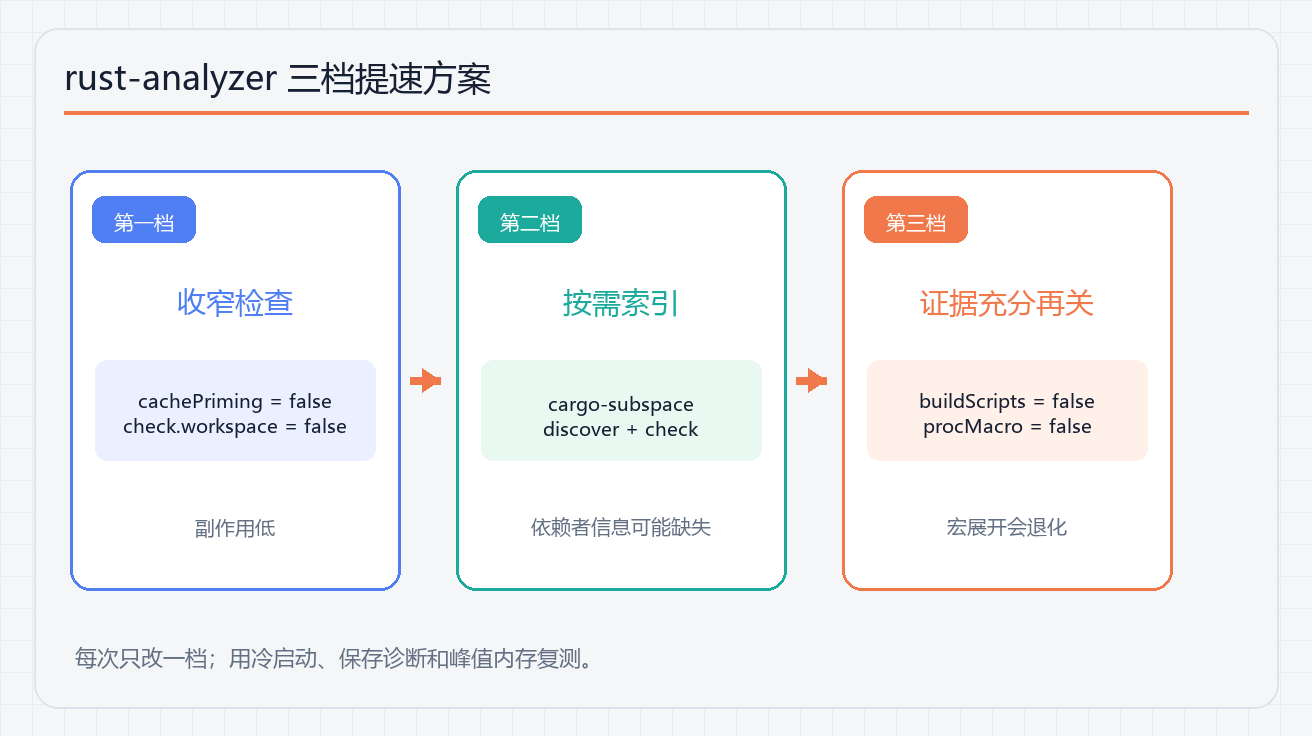
Do not turn off every performance setting at once. Narrow the workload in stages:
| Workspace situation | Start with | Main trade-off |
|---|---|---|
| One crate or a small workspace | Disable cachePriming and set check.workspace to false | Shared-library changes will not refresh every dependent error immediately |
| Dozens to hundreds of crates | Apply level one, then evaluate cargo-subspace | References in unloaded crates are incomplete |
Heavy build.rs or procedural macros | Disable build scripts or proc macros only when evidence points there | Macro expansion, generated code, and some configuration analysis degrade |
The goal is not to make rust-analyzer less capable; it is to stop paying for work unrelated to the current task. Change one level at a time and measure with the same project, tool version, and approximately the same cold-start conditions.
1. rust-analyzer’s three diligent defaults
rust-analyzer is not merely a completion engine that tries to do as little as possible. To make completion, navigation, and renaming feel fast, it spends work at startup and on save. Three defaults are especially expensive:
1. Warm every dependency at startup (cachePriming)
By default, rust-analyzer.cachePriming.enable = true. When you open a project, it walks the dependency graph and type information for every workspace crate, calculating results that you may never request.
The benefit is almost zero-latency completion afterward. The cost is the first several seconds of startup and hundreds of megabytes — sometimes more than 1 GB — spent on possibilities.
2. Check the whole workspace on save (check.workspace)
By default, rust-analyzer.check.workspace = true. Every time you press Ctrl+S, it runs cargo check for the entire workspace rather than just the current crate.
3. Index the whole dependency graph eagerly
After reading the graph from cargo metadata, rust-analyzer eagerly loads the item tree for every crate. A workspace with 26 crates can pull in dozens or hundreds of dependencies per crate. None of them are skipped.
Each decision is reasonable in isolation: caching makes completion fast, full checks reveal more errors, and eager indexing makes navigation complete. Together, they make you pay the full time and memory cost for code you may never touch.
2. Measured: diligent versus lazy
I ran two local measurements with rust-analyzer v0.3.2997 on Windows with the MSVC toolchain; the run was recorded on 2026-08-03.
Measurement one: a synthetic 26-crate workspace (3,217 lines, chained dependencies)
I used the official analysis-stats command for a full type-analysis run:
| Mode | Analysis time | Memory | Wall-clock time |
|---|---|---|---|
| All 26 crates | 2.36s | 521MB | 9.8s |
| One crate | 2.08s | 523MB | 2.7s |
The actual computation was almost the same because dependencies were shared. The wall-clock time was 3.6 times longer, and the extra seven seconds went into discovering the project structure and loading every crate’s item tree.
Measurement two: the real fd project
| Metric | Value |
|---|---|
| Project code in the workspace | 8,273 lines |
| Dependency code | 2,526,193 lines (305x more) |
| Total analysis time | 6.08s |
| Peak memory | 1,409MB |
| Wall-clock time | 17.4s |
The ratio is the important part: your code is 0.3% of the total; dependency analysis accounts for most of the time and memory in this run. That is why adding serde, tokio, or clap can make an IDE feel slow immediately. Your code did not suddenly become complicated; the dependency world became larger.
2.1 Put the measurement in context
There are three boundaries to keep in mind:
analysis-statsis rust-analyzer’s batch analysis tool. It is not the same as interactive LSP latency inside VS Code.Totaland peak memory are measurements from this local run, not fixed costs for every rust-analyzer project.- The synthetic all-crates versus one-crate comparison mainly exposes project discovery and item-tree loading. It does not mean every monorepo will become 3.6 times faster.
These numbers show that dependency scale can become a cost; they are not a performance guarantee for your machine.
3. First level: turn off three over-diligent settings
For small and medium projects, three lines in VS Code’s settings.json can improve startup and save-time feedback:
{
  "rust-analyzer.cachePriming.enable": false,
  "rust-analyzer.check.workspace": false,
  "rust-analyzer.checkOnSave": true
}
cachePriming.enable = falsecancels full startup warm-up. The first completion after opening a file may be slower because it is calculated on demand, but startup time and memory use fall.check.workspace = falsechecks the current crate and its dependencies on save instead of the entire workspace. The trade-off is that errors in other crates will not refresh immediately after a shared-library change.- Keep
checkOnSaveenabled. Diagnostics still run; the scope is simply narrowed to the current crate.
In my fd measurement, this level brought the cold start from 17.4 seconds to under ten seconds. Most of the saved time came from avoiding eager dependency-tree work. The result depends on the tool version, cache state, and machine, so it is not a universal guarantee.
Boundary: enable this directly for a single-crate project or a small workspace (fewer than ten crates). If you routinely need every dependent-crate error as soon as a low-level crate changes, restore check.workspace = true or use the next level.
4. Second level: cargo-subspace for actual lazy loading
Disabling cachePriming avoids the warm-up, but the index can still cover the whole workspace. For a monorepo with hundreds of crates, cargo-subspace takes a more aggressive approach:
Open a file, and the editor tells rust-analyzer about that file’s crate and its dependencies. A crate that has not been loaded is not part of the current project model.
The tool works around one-shot Cargo workspace discovery with rust-analyzer’s workspace.discoverConfig and rust-project.json mechanisms. It obtains the dependency graph through cargo metadata, then trims the project model to the current crate and its dependencies. The cargo-subspace README gives this VS Code setup:
rustup component add rust-src
cargo install --locked cargo-subspace
Then add this to VS Code’s settings.json:
{
  "rust-analyzer.workspace.discoverConfig": {
    "command": ["cargo-subspace", "discover", "{arg}"],
    "progressLabel": "cargo-subspace",
    "filesToWatch": ["Cargo.toml"]
  },
  "rust-analyzer.check.invocationStrategy": "once",
  "rust-analyzer.check.overrideCommand": [
    "cargo-subspace",
    "check",
    "$saved_file"
  ]
}
Run rust-analyzer: Reload Workspace after saving. If the project model does not update, run rust-analyzer: Restart Server.
What is the cost? Lazy loading can remove information about dependents of the current crate. Find References, cross-crate rename, and symbol search for unloaded crates may be incomplete. The cargo-subspace README also says that the project is currently untested on Windows. The Windows measurements in this article cover rust-analyzer itself, not cargo-subspace; validate it in WSL/Linux first or treat Windows support as an open verification item.
This exposes the underlying trade-off: rust-analyzer’s default diligence is designed to make navigation available everywhere, while lazy loading exchanges complete knowledge for a result that is sufficient for the current task.
5. Third level: disable build scripts and proc macros only when necessary
If build.rs or procedural macros are the actual bottleneck, narrowing the index is not enough. The official configuration reference lists both capabilities as enabled by default:
{
  "rust-analyzer.cargo.buildScripts.enable": false,
  "rust-analyzer.procMacro.enable": false
}
This is not a general recommendation. Generated configuration, procedural-macro expansion, and some derive analysis may disappear. Projects that rely heavily on macros from crates such as serde, tokio, or sqlx are especially likely to notice. Use this level only when startup logs or measurements point to build scripts or proc macros.
Keep a copy of the original settings, restart rust-analyzer for each comparison, and check completion, go-to-definition, and save-time diagnostics. Restore the defaults if missing macro expansion causes false errors or widespread unresolved types.
6. Eight rust-analyzer improvements worth enabling in the first half of 2026
Configuration is not the whole story. rust-analyzer continues to work on lower memory use, faster diagnostics, and less noise. Many improvements arrive through upgrades, but the exact behavior still depends on the corresponding version’s changelog. From issues #304 through #339, these eight changes matter most for daily work:
1. Upgrade to save memory: garbage collection replaces intern caches (#307)
The upstream changelog reports that moving trait-solver type objects from manual interning to garbage-collected storage saved 648MB of memory and 31 seconds of startup time on rust-analyzer’s own project. Stopping the expansion of built-in derives (#308) later reported roughly 180MB more, and the Windows build switched to the mimalloc allocator (#331). These are upstream project results, not measurements from the fd run in this article.
These improvements are spread across releases from late 2025 into early 2026. The first action is still simple: update rust-analyzer to the current stable version. Run rust-analyzer: Show RA Version from the command palette and compare it with the official release/changelog instead of treating a one-week age threshold as a universal rule.
2. Trait-error diagnostics (#326): explanations instead of a bare bound failure
the trait bound X is not satisfied is one of Rust’s most frustrating errors. The newer diagnostics record and display the obligation chain: which implementation is missing and which associated type does not line up. Issue #338 continues this work by showing more of the chain.
3. New diagnostics with quick fixes
The first half of 2026 added many diagnostics with actions attached:
type_mismatchcan suggest.awaitwhen aFutureis used asT(#334).- An array-length mismatch can offer a correction for
[u8; 3]versus[u8; 4](#336). cannot-index-intoexplains why aVec<T>cannot be indexed by aString(#329).type-must-be-known,unused-must-use, andmismatched-array-pat-lenadd more targeted feedback (#326–329).
The point is not more errors. It is that an error list can show a repair path instead of sending you to documentation to guess.
4. Exclude dependencies and the standard library from reference search (#324)
Find References can otherwise include dependencies and std, filling the results with implementation details from crates such as serde. The newer option lets you prioritize references in your own code — noise is reduced, but external results do not necessarily disappear completely.
5. Create a Rust project from VS Code (#333)
The rust-analyzer: Create Rust project command can create a Cargo project, choose its directory, and open it in a new window without a separate terminal step.
6. Fold chained expressions and move type hints (#322)
Long chains such as .map().filter().collect() can be folded, and inlay hints can be placed at the end of a line instead of beside the variable name.
7. Better debugging commands and less noisy hover output (#331, #337)
Evaluate Predicate can evaluate a trait-constraint expression while debugging. Hover output can also hide private fields when you inspect a type from another crate.
8. Fine-grained request cancellation (#314)
Long-running completion or navigation work can now be cancelled at request level. Pressing Esc no longer has to wait for one large operation to finish.
6. Summary: make rust-analyzer a tool again
| Problem | Diligent default | Lazy recommendation | Best fit |
|---|---|---|---|
| Startup warm-up | Full cachePriming | Disable it | Every project |
| Save-time checks | Entire workspace | Current crate | Fewer than 10 crates |
| Index scope | Every crate | cargo-subspace on demand | Monorepos |
| Build scripts and proc macros | Enabled by default | Disable only with evidence | build.rs/proc macros are the bottleneck |
| Version | Updated irregularly | Update weekly | Everyone |
Three rules generalize to other slow IDEs:
- Tools default to full capability, not necessarily to your efficiency goal. Inspect global work before accepting it.
- An upgrade is the cheapest optimization. Upstream has reported improvements in the hundreds of megabytes, but those were measured on specific projects; measure your own workspace.
- Clearer errors matter more than fewer errors. Diagnostics determine how often your work is interrupted.
An 8,000-line Rust project can make rust-analyzer chew through its whole dependency world. Efficiency is not making the tool work harder; it is making it do only the work you need.
If your IDE is lagging, change one level at a time and record cold-start time, save-time diagnostics, and peak memory.
FAQ
Q: Does disabling cachePriming make completion permanently slower?
A: No. The first query is computed on demand and later results are still cached. The usual trade-off is a shorter startup and lower peak memory.
Q: When should rust-analyzer.check.workspace = true remain enabled?
A: Keep it when you frequently change shared libraries and need every dependent-crate error immediately after saving. A single crate or small workspace can usually disable it.
Q: Does cargo-subspace affect Find References?
A: Yes. References in downstream crates that have not been loaded will be missing, so it is better suited to a large monorepo workflow that focuses on one crate at a time.
Q: Can the timing and memory numbers be reproduced exactly?
A: They came from the stated fd project and synthetic workspace. Hardware, toolchain versions, and cache state affect the result; rerun the measurement under matching conditions rather than treating the numbers as guarantees.
Related reading
- Rust compiler pipeline refactoring: 35% shorter builds
- Rust CI build caching with sccache
- Rust Sidecar: moving CPU-heavy work out of the main service
References
- rust-analyzer changelog #304–#339: https://rust-analyzer.github.io/thisweek/
- rust-analyzer configuration reference (
cachePriming/check.workspace/procMacro): https://rust-analyzer.github.io/book/configuration.html - cargo-subspace README (lazy indexing, VS Code configuration, and Windows status): https://github.com/ethowitz/cargo-subspace
- Local measurement environment: rust-analyzer v0.3.2997 (2026-08-03), Windows 11, MSVC toolchain, and
analysis-statsfull type analysis