You installed rust-analyzer. Completion, navigation, and refactoring work normally. Then you write your first bug and press F5.
VS Code shows an unfamiliar message: launch.json is missing, or “No debugger found.”
You search for a tutorial and see CodeLLDB, MS C++ tools, rust-lldb, lldb.consoleMode, and sourceFileMap. Thirty minutes later you give up on debugging and return to temporary println! logging.
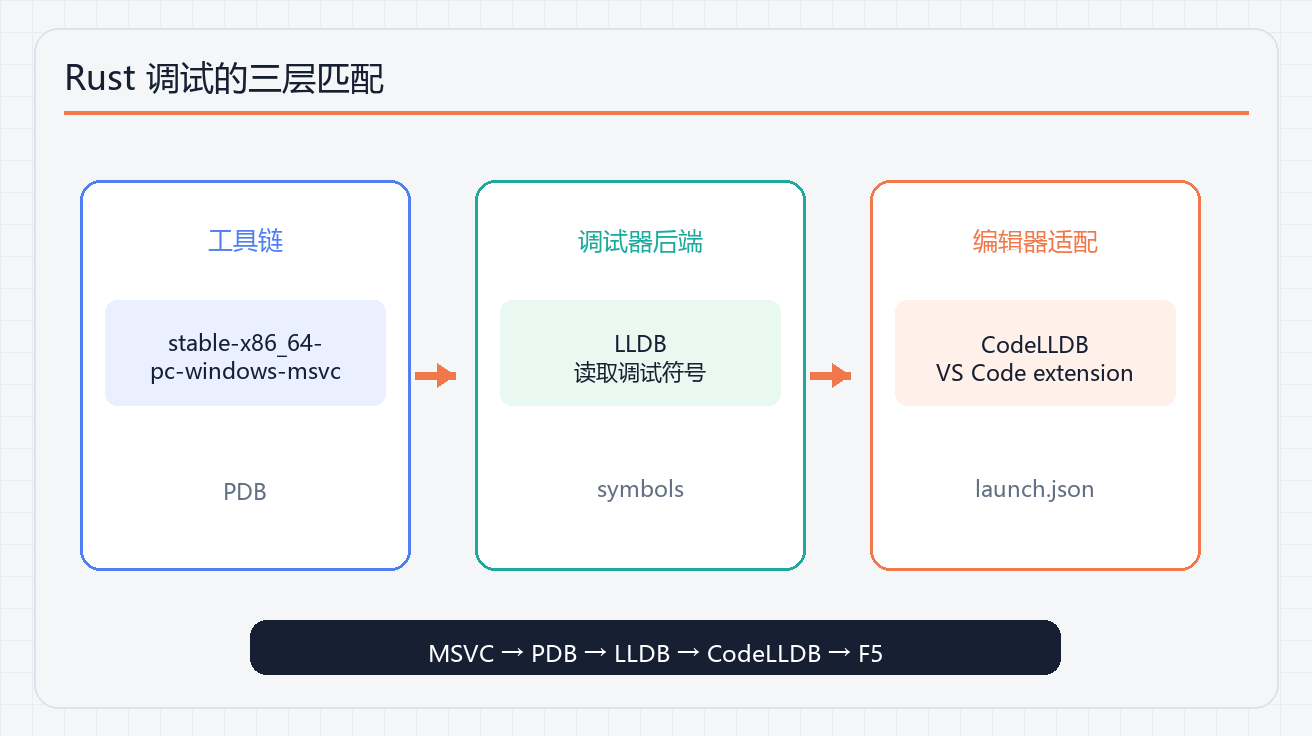
The root problem is not that debugging Rust is inherently difficult. The toolchain, debugger backend, and editor adapter are three separate parts. If any one of them does not match, F5 is dead. This guide connects all three through one complete debugging session.
1. First layer: choose the right debugger backend
Rust does not produce a debugger. It produces debug information — DWARF or PDB — which LLDB or GDB must interpret. The right choice depends on the platform.
Windows with the MSVC toolchain (the rustup default): rustup does not provide an applicable rust-lldb component
This is the classic trap. After running rustup component add rust-lldb, you may see:
error: the 'rust-lldb.exe' binary, normally provided by the 'rustc' component,
is not applicable to the 'stable-x86_64-pc-windows-msvc' toolchain
The important boundary is not that LLDB can never run on Windows. It is that rustup does not provide an installable rust-lldb component for stable-x86_64-pc-windows-msvc. MSVC emits PDB debug information, so the debugger also needs the appropriate PDB reader. For an MSVC user, “just install rust-lldb” is usually a dead end.
Recommended: the CodeLLDB extension (vadimcn.vscode-lldb)
Install CodeLLDB from the VS Code marketplace. It bundles its own LLDB, so you do not need to install a system debugger. In the Windows + MSVC session used for this article, it read the PDB symbols successfully. That makes it the first option to try, while the exact capability still depends on the extension version and debugger build.
code --install-extension vadimcn.vscode-lldb
Alternative: Microsoft C++ tools (ms-vscode.cpptools)
The Visual Studio debugger integration can also read PDB files, but it targets C++: Rust type views and macro support are weaker, and the configuration is more verbose. Use it mainly when you also debug C++.
Linux and macOS: rust-lldb and CodeLLDB are both reasonable starting points, but still match the debugger version, toolchain, and symbol format.
The short version: on Windows, use CodeLLDB for Rust by default; on other platforms, rust-lldb is often enough.
2. Second layer: configure launch.json from scratch
Once the debugger is installed, F5 will offer to create launch.json. Choose the CodeLLDB template and adjust it to this:
{
  "version": "0.2.0",
  "configurations": [
    {
      "type": "lldb",
      "request": "launch",
      "name": "Debug (Rust)",
      "program": "${workspaceFolder}/target/debug/debug-demo.exe",
      "args": [],
      "cwd": "${workspaceFolder}",
      "stopOnEntry": false,
      "terminal": "console"
    }
  ]
}
Field by field:
| Field | Meaning | Common mistake |
|---|---|---|
type | lldb for CodeLLDB; cppvsdbg for Microsoft C++ tools | A wrong value prevents launch |
request | launch starts a process; attach connects to one already running | Use attach for a service process |
program | The executable to debug | Pointing to src/main.rs instead of the binary |
args | Command-line arguments passed to the program | Often needed when debugging a CLI tool |
cwd | The program’s working directory | Relative file paths fail when it is wrong |
stopOnEntry | Pause at process entry | Useful for early initialization |
terminal | Where stdout is displayed | console for the integrated terminal; external for another terminal |
The .exe in program is Windows-specific. Linux and macOS binaries usually have no extension; if a Cargo binary contains hyphens, use the actual filename under target/debug/ rather than guessing.
The key idea: program is the compiled artifact, not the source file. Build once before debugging:
cargo build # debug build with symbols
If F5 reports that the file does not exist, the usual causes are that you have not built yet or that the binary name does not match the name in Cargo.toml (hyphens become underscores in the executable name).
3. A real debugging session
I ran a complete session with a 47-line example program that applies discounts and totals a batch of orders. The output below came from a local debug-demo session; the environment is recorded at the end, so treat it as a reproducible experiment rather than a fixed CodeLLDB display format:
let mut orders: Vec<Order> = Vec::new();

for i in 0..10 {
    let mut order = Order::new(i);
    order.add_item("rust book", 45.0);
    order.add_item("coffee", 8.5);
    apply_discount(&mut order, 10.0); // Breakpoint A: hit when i == 5
    orders.push(order);
}

let total = compute_batch_total(&orders);
println!("batch total: {:.2}", total); // Breakpoint B: inspect total
Conditional breakpoint: right-click Breakpoint A, choose Edit Breakpoint, and enter i == 5. The program stopped on the sixth loop iteration:
-> 42  apply_discount(&mut order, 10.0);
(lldb) frame variable
(unsigned int) i = 5
(debug_demo::Order) order = {
  items = { len = 2 }
  total = 53.5
  id = 5
}
orders.len = 5 because five orders had already been pushed, and order.total = 53.5 because the discount had not been applied yet. A conditional breakpoint is the fastest way to investigate the Nth iteration of a loop without pressing Continue ten times.
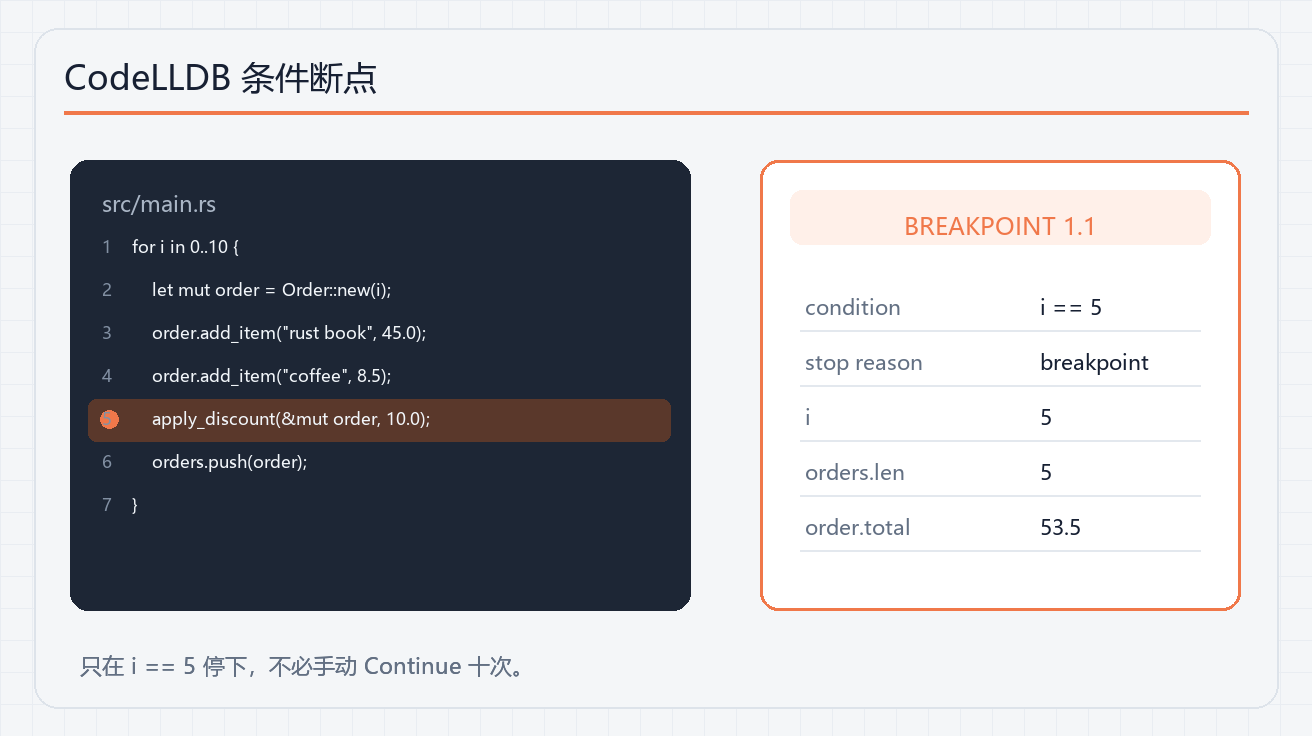
The Variables panel expanded the Order fields, and bt displayed the call chain main → call_once → __rust_begin_short_backtrace.
At Breakpoint B, just before println!, the debugger showed total = 481.49999999999989. Mathematically it should be 481.5; binary floating-point representation exposed the small difference. That gap between compiler arithmetic and decimal intuition is exactly the kind of detail a debugger can show more clearly than println!.
4. Common traps, ranked by frequency
1. The breakpoint is never hit: check optimization, profile, and binary/source alignment first
Code built with cargo build --release can be inlined and reordered. Breakpoints may not bind or may stop on a nearby line. Use cargo build for debugging and check that the status bar is not selecting a release task.
2. Variables look incomplete: the current LLDB backend may lack full Rust language support
When the backend prints this warning, variable rendering is limited:
warning: This version of LLDB has no plugin for the language "rust".
Inspection of frame variables will be limited.
Option, Result, and enums may appear as raw fields such as __0, while a String may show a buffer instead of text. This is a limitation in the current LLDB backend, not necessarily a CodeLLDB configuration error. Breakpoints and numeric variables may still work; do not treat __0 alone as proof that the setup is broken.
3. Macro expansion moves the source line
Code emitted by println! and vec! does not always map one-to-one to the line you see. A breakpoint on the first ordinary statement after a macro call is generally more reliable.
4. The program cannot find a file: inspect cwd and args
If a program reads ./data.txt and fails, check whether cwd is the directory it expects. For a clap CLI, put arguments in args rather than manually starting the process in a terminal.
5. Attach mode: request: attach plus pid
For a long-running service such as a Tokio server, use attach mode and set pid to the process ID, or use ${command:pickProcess}.
5. Summary: match the three layers
| Layer | Choice | Key point |
|---|---|---|
| Toolchain | MSVC on Windows (the default) | Produces PDB symbols |
| Debugger | CodeLLDB on Windows / rust-lldb elsewhere | It must read the symbols |
| Configuration | program points to a debug artifact | Forgetting cargo build breaks everything |
| Daily habit | cargo build plus conditional breakpoints | Release builds can hide breakpoints |
Three rules are enough to remember:
- A debugger is chosen by compatibility, not installed by wishful thinking. Match MSVC, PDB, and the LLDB adapter before editing JSON.
- The core of launch.json is
program,args, andcwd. Get those three right first. - Conditional breakpoints repay the one-time setup cost. They are especially useful for loops and batch processing.
The expensive part of Rust debugging is giving up after the first failed setup. Spend the twenty minutes once, and every later F5 can stop where you need it.
If the process still will not start, record the toolchain target triple, CodeLLDB version, actual program path, full error text, and whether cargo build succeeded. That separates a compile problem from symbol loading and launch configuration instead of encouraging repeated JSON edits.
FAQ
Q: Can the Windows MSVC toolchain use rust-lldb directly?
A: Usually not. rustup’s rust-lldb is not applicable to stable-x86_64-pc-windows-msvc; Windows MSVC users should start with CodeLLDB.
Q: Why can program not point to src/main.rs?
A: The debugger launches an executable with debug symbols. Run cargo build, then point program at the binary under target/debug/.
Q: What should I check first when a breakpoint is not hit?
A: Confirm that you are using a debug build rather than --release, then check program, cwd, and whether the source matches the binary. Macro lines can also have imperfect source mappings.
Q: Is CodeLLDB broken when Option or Result appears as internal fields?
A: Not necessarily. Some LLDB versions lack complete Rust language support, so complex enums may appear as their low-level layout while breakpoints and numeric variables still work.
Related reading
- Graceful shutdown in Axum: finishing requests before exit
- Building an asynchronous Rust microservice with Axum
References
- CodeLLDB documentation: https://github.com/vadimcn/vscode-lldb
- rust-analyzer debugging in VS Code: https://rust-analyzer.github.io/book/vs_code.html
- Measurement environment: VS Code 1.121, rust-analyzer v0.3.2997, CodeLLDB v1.12.2, Windows,
stable-x86_64-pc-windows-msvc, and Rust 1.95.0