
The verdict first: keeping half the data is the slowest case
You’re filtering one million floats. Which selectivity is slowest? The counter-intuitive answer: keeping exactly half. Your code is not bad — the CPU’s branch predictor has been reduced to a coin flip, guessing wrong on every second element and paying a 15-20 cycle penalty each time.
Delete that if, replace it with one line of arithmetic, and the worst case gets 3-4x faster — with a runtime that no longer depends on the data at all.
The experiment comes from Serhii Potapov’s August 2 blog post, which earned 290+ points on Hacker News . Reading someone else’s numbers wasn’t enough, so I reproduced everything on my own machine (Windows 10 x64 / i5-12400F / rustc 1.97.1). The claim holds. Every number labeled “measured” below is a real result from that machine.

The experiment: a filter anyone would write
The problem is plain: filter a slice of f64 and return the elements greater than a threshold — something database engines do all day long. The idiomatic version:
pub fn filter_iter(input: &[f64], threshold: f64) -> Vec<f64> {
    input.iter().copied().filter(|&x| x > threshold).collect()
}
The input is one million random floats uniformly spread over 0.0..100.0. The threshold is chosen so the filter keeps 1%, 25%, 50%, 75%, or 99% of the elements. Here is what the original author measured with criterion on an i7-10875H laptop:
| kept | output size | time |
|---|---|---|
| 1% | ~10k | 0.59 ms |
| 25% | ~250k | 2.69 ms |
| 50% | ~500k | 3.94 ms (slowest) |
| 75% | ~750k | 2.75 ms |
| 99% | ~990k | 1.49 ms |
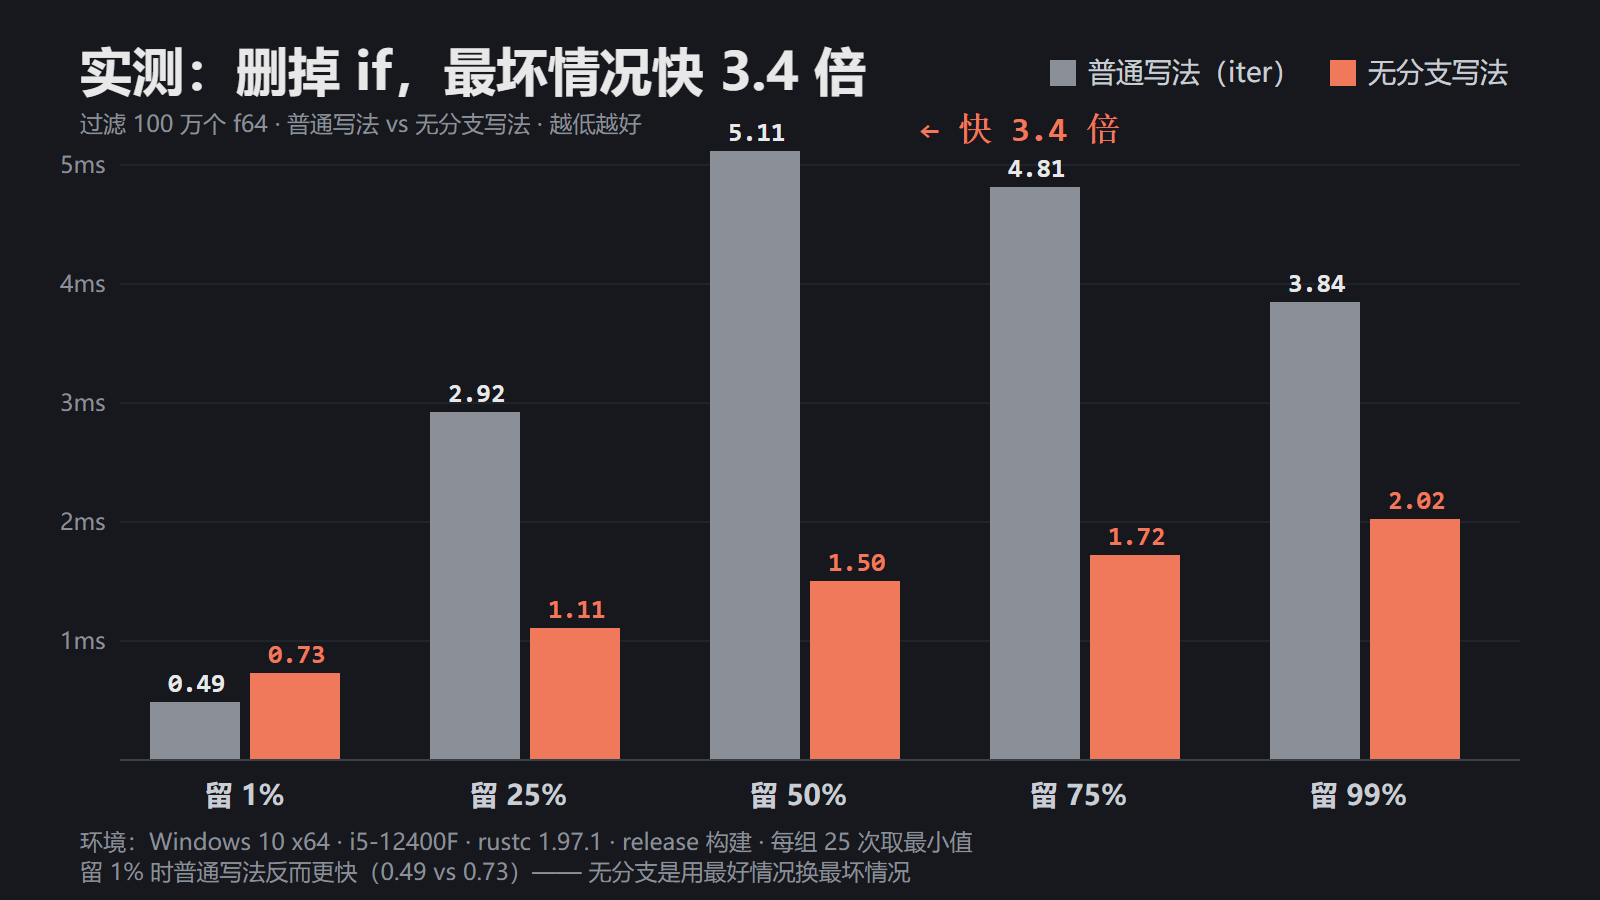
My machine (i5-12400F, release build, min of 25 runs per case) shows the same shape:
| kept | time |
|---|---|
| 1% | 0.49 ms |
| 25% | 2.92 ms |
| 50% | 5.11 ms (slowest) |
| 75% | 4.81 ms |
| 99% | 3.84 ms |
Look at the 50% row: it copies only half of the elements, yet it is the slowest case of all. Keeping 99% means copying almost twice as much data, and still it is faster. The amount of input is identical in every row, and the amount of output clearly does not explain the timings. Something else is going on.
Ruling out a suspect: Vec reallocation
Every Rust developer’s first reflex: collect() does not know the output size in advance, so the Vec grows and reallocates along the way. Preallocate!
pub fn filter_prealloc(input: &[f64], threshold: f64) -> Vec<f64> {
    let mut out = Vec::with_capacity(input.len());
    for &x in input {
        if x > threshold {
            out.push(x);
        }
    }
    out
}
Measured at 50% kept: 4.42 ms — about 14% faster than the idiomatic version (5.11 ms). Real, but clearly not the bottleneck. The reallocations exist; they were never the villain.
What the CPU guesses behind your back
A modern CPU does not execute one instruction at a time. It runs a deep pipeline: while one instruction executes, the next dozens are already being fetched and decoded. This works beautifully, until the instruction stream hits a fork:
if x > threshold { /* keep */ } else { /* skip */ }
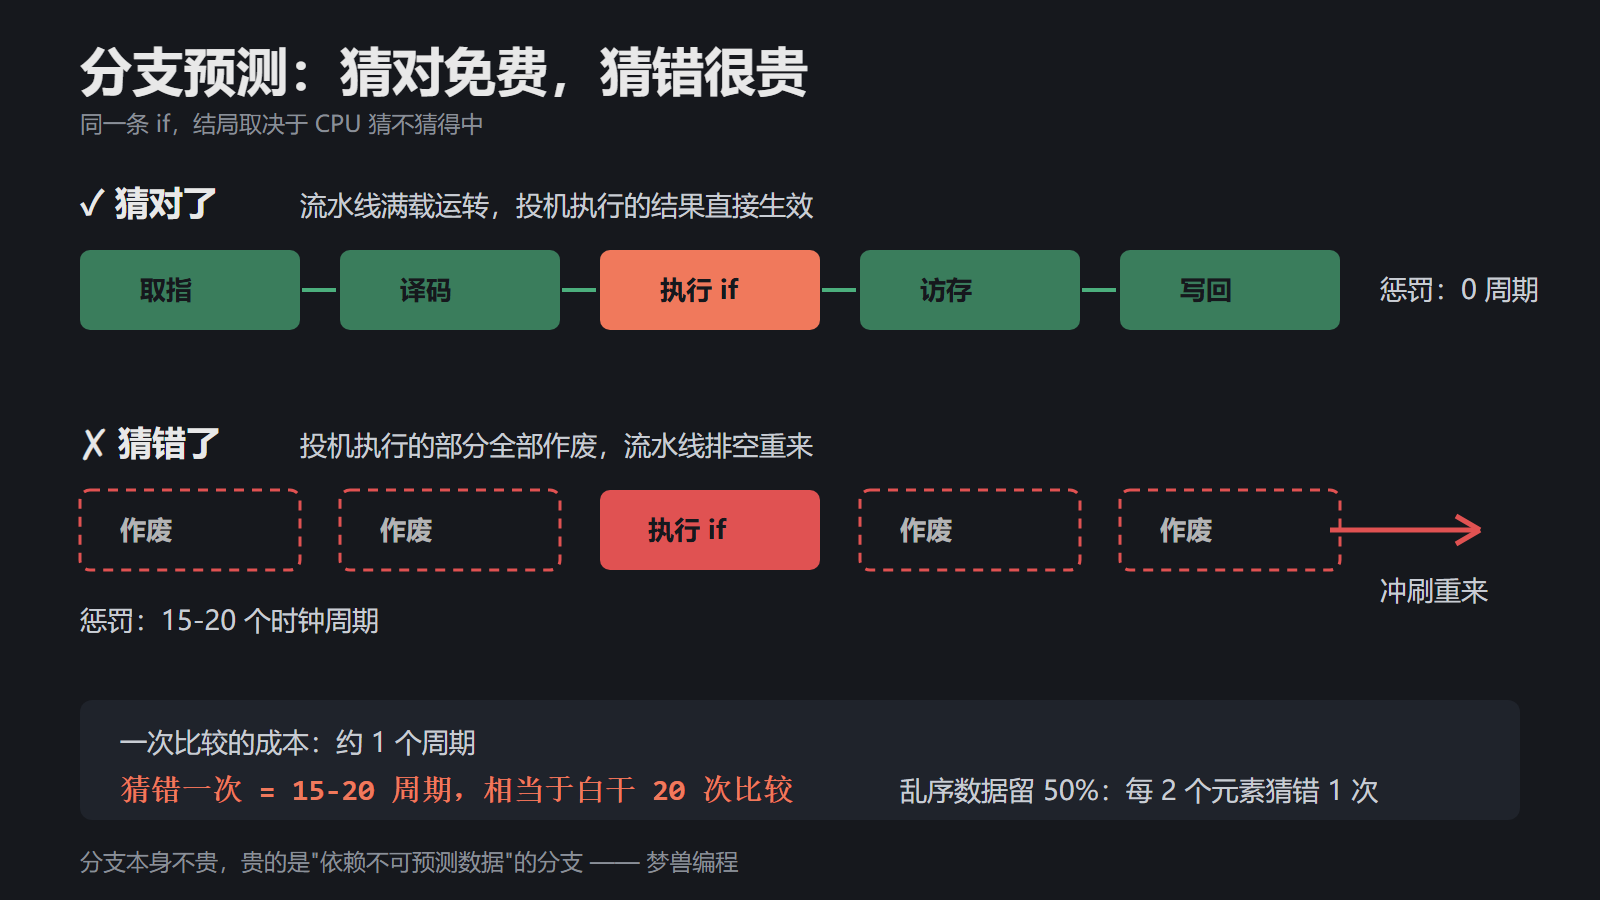
Which way does the road go? The CPU cannot know until the comparison actually finishes. And it refuses to wait — it guesses, then speculatively runs ahead along the guessed path. The hardware doing the guessing is the branch predictor.
A correct guess is free. A wrong guess is expensive: everything speculatively started is thrown away, the pipeline flushes and restarts — roughly 15-20 cycles on a typical modern x86 core. The comparison itself costs about one.
The author compares the predictor to a barista who starts making your usual order the moment you walk in. If you are a regular, fantastic. If you order something random every day, the barista keeps pouring drinks into the sink.
Now the table makes sense:
- Keep 1%: the answer is almost always “skip”. The predictor guesses “skip” and is right 99% of the time. Nearly free.
- Keep 99%: the same story in the opposite direction.
- Keep 50% of shuffled data: there is no pattern to learn. The predictor is reduced to a coin flip and is wrong on every second element. Half a million pipeline flushes at 15-20 cycles each adds up to roughly 2 ms of pure penalty on a 4 GHz core — pretty much the gap in the table.
Note that the villain is not the branch itself. It is the branch that depends on unpredictable data. Which suggests a fun experiment.
The smoking gun: same code, 2.8x faster when sorted
If mispredictions are the problem, we should be able to keep the same data, the same threshold and the same code, and change only the order of the elements. Sort the input (outside the measured section, of course) and rerun the 50% case:
| input | time |
|---|---|
| shuffled | 5.20 ms |
| sorted | 1.87 ms |
Same million floats. Same function. 2.8x faster (4.5x on the author’s machine). On sorted data the branch says “skip” for the entire first half and “keep” for the entire second half — a pattern even the simplest predictor learns after one miss.
The famous Stack Overflow question with 27k upvotes, “Why is processing a sorted array faster than processing an unsorted array?” , is about exactly this effect.
Of course, sorting is not a fix: sorting costs more than the filtering itself, and we usually need the original order anyway. But now we know precisely what to fix — can we keep the data shuffled and still deny the CPU its coin flip?
The branchless rewrite: turn a decision into arithmetic
The idea of branchless programming is to remove the unpredictable branch entirely, so there is nothing to guess. Instead of deciding whether to write an element, we always write it, and use the comparison to decide where the next element goes:
pub fn filter_branchless(input: &[f64], threshold: f64) -> Vec<f64> {
    let mut out = vec![0.0; input.len()];
    let mut n = 0;
    for &x in input {
        out[n] = x;
        n += (x > threshold) as usize;
    }
    out.truncate(n);
    out
}
Take a minute to appreciate the trick:
- Every element is written to
out[n]unconditionally. (x > threshold) as usizeis 1 when we keep the element and 0 otherwise.- If the element is kept, the cursor
nmoves forward. If not, the next iteration simply overwrites the rejected value. - At the end,
nholds the number of kept elements, andtruncate(n)cuts off the garbage tail.
The comparison is still there, but its result is now used as a number, not as a decision about where the program goes next. In compiler terms, we turned a control dependency into a data dependency. In the generated assembly the comparison becomes a seta instruction that just produces 0 or 1. There is no fork in the road anymore, so there is nothing to mispredict.
A careful reader may object: out[n] = x performs a bounds check, and the loop condition is also a branch. True! But those branches go the same way a million times in a row, so the predictor handles them for free. Only the unpredictable branch had to go.
Measured: 3.4x faster in the worst case, slower in the best
| kept | idiomatic | branchless | speedup |
|---|---|---|---|
| 1% | 0.49 ms | 0.73 ms | 1.5x slower |
| 25% | 2.92 ms | 1.11 ms | 2.6x faster |
| 50% | 5.11 ms | 1.50 ms | 3.4x faster |
| 75% | 4.81 ms | 1.72 ms | 2.8x faster |
| 99% | 3.84 ms | 2.02 ms | 1.9x faster |
(Measured on my machine, release build, min of 25 runs. On the author’s machine the worst case improved by ~3.8x — hence the “almost 4x” claim.)
Two things worth noting:
First, the branchless column is almost flat. The running time no longer depends on the data — exactly what we wanted. It grows slowly with output size because every element costs one write.
Second, the price is real. At 1% kept the idiomatic version wins: an almost-always-correctly-predicted branch is nearly free, while the branchless version faithfully performs one million writes. Branchless code is not faster in general — it trades the best case for the worst case.
One honest observation: LLVM did not do this for you automatically — otherwise the two columns would not differ by 3x. For loops where the write position depends on the data, the compiler stays conservative and will not rewrite memory behavior on its own. This optimization still belongs to humans.
When to use it, and when to leave it alone
Most of the time, leave it alone. Branchless code is harder to read and easier to get wrong. Besides, compilers know a lot of tricks and already handle many cases silently.
The technique pays off in exactly one situation: a profiler points at a hot loop, and that loop contains a branch on unpredictable data. The order is always: measure first, optimize second. Performance work without profile data is just guessing.
Conversely, if you write database engines, columnar scans, or SIMD filters — code where the data distribution is chosen by the user — branchless turns the worst case into the normal case, and it deserves a place in your toolbox.
Two common traps, shown as code
Trap one: fake branchless. Many people read “remove the if” and write this:
// ❌ Wrong: the branch is still there, plus an extra pop
for &x in input {
    out.push(x);
    if x <= threshold {
        out.pop();
    }
}
That if is still the same branch on unpredictable data — every mispredict still costs 15-20 cycles, and pop adds a bounds check on top. It is slower than the plain idiomatic version. “Looks branchless” and “is branchless” are different things. Truly branchless code lets arithmetic decide the write position; there is no fork at all:
// ✅ Right: the comparison becomes a number; nothing left to guess
out[n] = x;
n += (x > threshold) as usize;
Trap two: forcing branchless onto a predictable branch. If 99% of the data gets dropped, the branch says “drop” almost every time, the predictor nails it, and the idiomatic version is already optimal:
// ❌ Wrong: branchless on a keep-1% workload, 0.73 ms
let out = filter_branchless(&input, 99.0);

// ✅ Right: predictable branch stays an if, 0.49 ms, 1.5x faster
let out = filter_iter(&input, 99.0);
The rule of thumb, in one sentence: rewrite as arithmetic only when the branch is hard to guess; keep the if when it isn’t.
The full reference code: copy and run
You don’t have to take my word for any number above. This is the exact benchmark behind this article — zero third-party crates. Save it as main.rs and reproduce every phenomenon with one command:
rustc -O main.rs && ./main
use std::hint::black_box;
use std::time::Instant;

/// Fixed-seed xorshift64*, generating f64 values uniform in 0.0..100.0
struct Rng(u64);

impl Rng {
    fn next_f64(&mut self) -> f64 {
        let mut x = self.0;
        x ^= x >> 12;
        x ^= x << 25;
        x ^= x >> 27;
        self.0 = x;
        let u = x.wrapping_mul(0x2545_F491_4F6C_DD1D) >> 11;
        u as f64 / (1u64 << 53) as f64 * 100.0
    }
}

/// Idiomatic version: iterator + collect
pub fn filter_iter(input: &[f64], threshold: f64) -> Vec<f64> {
    input.iter().copied().filter(|&x| x > threshold).collect()
}

/// Preallocated version: rules out Vec growth as the suspect
pub fn filter_prealloc(input: &[f64], threshold: f64) -> Vec<f64> {
    let mut out = Vec::with_capacity(input.len());
    for &x in input {
        if x > threshold {
            out.push(x);
        }
    }
    out
}

/// Branchless version: write every element, let the comparison pick the slot
pub fn filter_branchless(input: &[f64], threshold: f64) -> Vec<f64> {
    let mut out = vec![0.0; input.len()];
    let mut n = 0;
    for &x in input {
        out[n] = x;
        n += (x > threshold) as usize;
    }
    out.truncate(n);
    out
}

/// 25 runs per variant, keep the minimum; black_box stops the optimizer
fn bench(name: &str, f: fn(&[f64], f64) -> Vec<f64>, input: &[f64], thr: f64) {
    let mut best = f64::MAX;
    for _ in 0..25 {
        let t = Instant::now();
        let out = f(black_box(input), black_box(thr));
        let el = t.elapsed().as_secs_f64() * 1000.0;
        black_box(&out);
        if el < best {
            best = el;
        }
    }
    println!("  {name:<22}{best:>7.2} ms");
}

fn main() {
    let mut rng = Rng(0x9E37_79B9_7F4A_7C15);
    let input: Vec<f64> = (0..1_000_000).map(|_| rng.next_f64()).collect();

    println!("== Shuffled data, varying keep rates ==");
    for keep in [1.0, 25.0, 50.0, 75.0, 99.0] {
        let thr = 100.0 - keep; // x > thr keeps `keep`%
        println!("keep {keep}% (threshold {thr}):");
        // A wrong optimization is not an optimization: outputs must match bit for bit
        assert_eq!(filter_iter(&input, thr), filter_branchless(&input, thr));
        assert_eq!(filter_iter(&input, thr), filter_prealloc(&input, thr));
        bench("filter_iter", filter_iter, &input, thr);
        bench("filter_prealloc", filter_prealloc, &input, thr);
        bench("filter_branchless", filter_branchless, &input, thr);
    }

    println!("\n== Same code, sorted vs shuffled (keep 50%) ==");
    let mut sorted = input.clone();
    sorted.sort_by(|a, b| a.partial_cmp(b).unwrap());
    bench("iter(shuffled)", filter_iter, &input, 50.0);
    bench("iter(sorted)", filter_iter, &sorted, 50.0);
}
Run it on your own machine and all three phenomena show up: the parabola, the sorted speed-up, and the flattened branchless curve. On my i5-12400F, this exact program produced the numbers in the tables above.
FAQ
What is branchless programming? It rewrites a “should I execute this” control-flow decision into “always execute, and let the computed value decide where the data goes”. With no data-dependent branch left, the CPU branch predictor has nothing to mispredict.
Is branchless code always faster? No. When the branch outcome is easy to predict (e.g. keeping 1% or 99% of the data), the idiomatic version is nearly free, while the branchless version pays for one write per element. It trades the best case for the worst case.
How do I know if my code deserves a branchless rewrite? Profile first. Only when a profiler points at a hot loop containing a branch on unpredictable data is the technique worth it. Measure first, optimize second.
Sources
The experiment idea and the “original author’s data” come from Serhii Potapov’s post “Branchless Rust: Making a Filter 4x Faster by Removing an if” (published 2026-08-02 on greyblake.com, with the criterion benchmark repository branchless-rust-benchmarks), which reached the Hacker News front page on 2026-08-10 with 290+ points. Hardware figures such as the 15-20 cycle misprediction penalty come from that post and its cited sources — Daniel Lemire’s branch-prediction articles and Fedor Pikus’s CppCon 2021 talk “Branchless Programming in C++”. The classic discussion of sorted-vs-unsorted processing is the 27k-upvote Stack Overflow question “Why is processing a sorted array faster than processing an unsorted array?”. Every number marked as measured was produced locally (Windows 10 x64 / i5-12400F / rustc 1.97.1) by running the reference code in the previous section.
Related reading
If Rust performance interests you, you may also like:
- Rust 1.97.1 Emergency Fix: The Compiler Miscompilation That Silently Segfaulted Programs - when the optimizer itself crashes your code
- Your Rust project has 8,000 lines; rust-analyzer is chewing through 2.5 million - why the editor lags and how to fix it
- Rust Performance Pitfalls: When Rust Runs Slower Than Python - another counter-intuitive performance story
- Rust Performance Optimization: 7 Underused Features Every Senior Developer Knows - advanced Rust techniques
Found this useful? Like it so more people see it, and bookmark it for the next time you optimize a hot loop. If you have friends who write Rust, share it with them — especially anyone with a filter sitting on a hot path; it might save them a late-night profiling session. Questions and discussion are welcome in the comments.