Profiling Zig on Apple Silicon (M1/M2): A Survival Guide
Hey there! If you’re rocking a shiny new Apple Silicon Mac and diving into Zig development, congratulations! You’ve chosen a path that’s both scenic and fraught with challenges.
You’ll quickly discover a harsh reality: when you need to figure out why your code is slow, you’ll feel like you’re stranded in a vast performance analysis desert. The gods of profiling on Linux—perf, valgrind, a fully-functional tracy—either don’t work well or are completely absent on macOS.
perf? That’s a Linux kernel native, it’s not acquainted with your aarch64 macOS. valgrind? Sorry, it doesn’t play well with arm64 macOS either. tracy? It runs, but its most crucial feature, call-stack sampling, is crippled, like a toothless tiger.
Feeling like your M2 Pro isn’t so “pro” anymore? Don’t give up just yet. Even in this desert, there are a few oases. Today, I’ll introduce you to the “heroes” who can help you out on Apple’s new chips.
The Quick-Draw: Samply
When you need a quick “health check” on your program to see what it’s busy doing, Samply is the cowboy that draws its gun without a second thought.

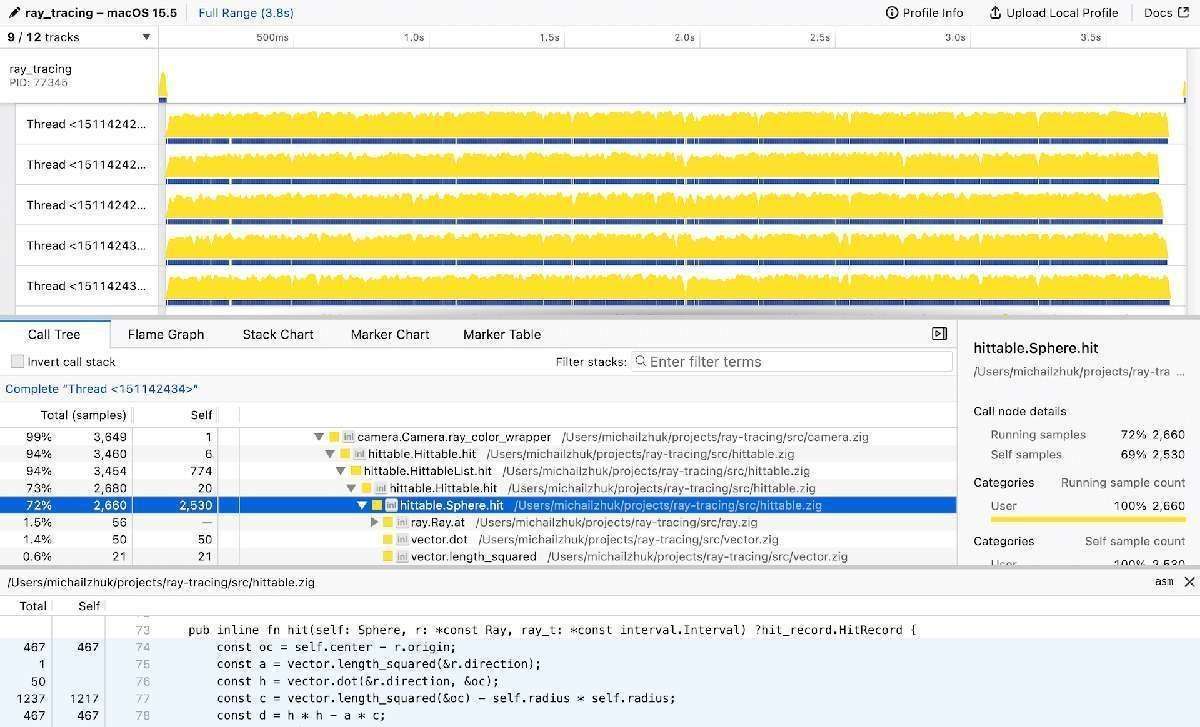
It’s a sampling profiler that, by default, takes a snapshot of your program’s stack every millisecond (1000Hz), whether your CPU is idle or churning. Best of all, it relies on Apple’s native Mach interface and uses the Firefox Profiler for its UI, which is feature-rich with flame graphs, call trees, and source code views.
How to hire this gunslinger?
Just one line with Homebrew:
brew install samply
How to use it?
Let it launch your program directly:
samply record <your_program>
Or attach to an already running process (requires some extra setup):
samply record -p <pid>
In a nutshell: Your go-to scout for everyday performance issues. It’s fast, intuitive, and easy to use.
The “Earthy” Powerhouse: poop
You read that right. The tool is called poop (short for Performance Optimizer Observation Platform). Don’t laugh; this is a powerful tool crafted by the creator of Zig, Andrew Kelley himself.
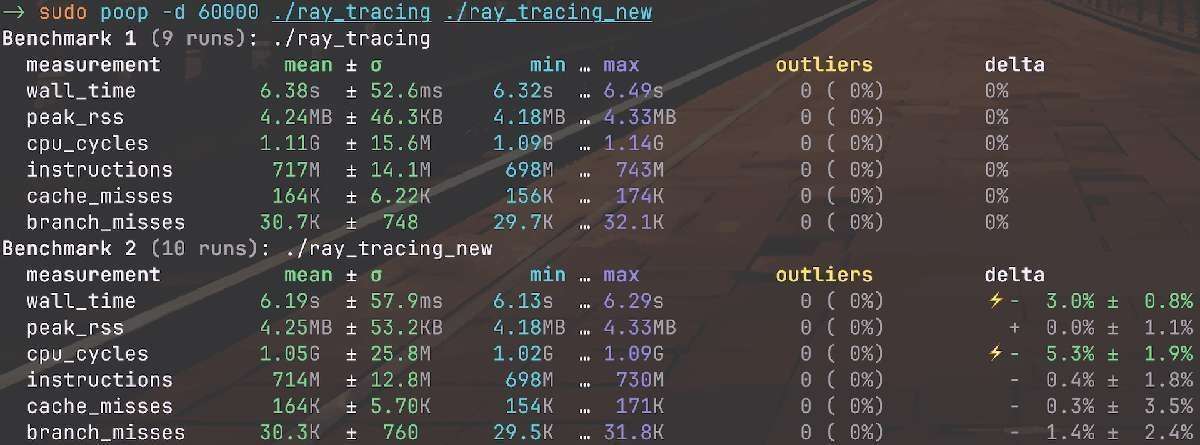
The name might be a bit too down-to-earth, but its power will blow you away. It doesn’t just look at time spent; it goes down to the hardware level, telling you things like “how many times branch prediction failed” or “how many instructions were executed.” When you want to do a precise performance comparison between two code changes, poop is your ultimate referee.
However, this powerhouse is a bit picky. The official poop depends on perf, so it’s a no-go on macOS. Fortunately, a community hero has forked it to run on Apple Silicon using Apple’s private kperf framework.
How to summon this hidden master? You’ll need to clone it from a specific branch and build it manually (check the original source for detailed steps, it’s a bit of a hassle but totally worth it).
How to use it?
Since it uses private APIs, it requires root privileges:
sudo poop <command1> <command2> ...
It will run and compare the hardware performance counters for these commands, telling you which version is truly “faster.”
In a nutshell: Weird name, but it’s the indispensable judge for iterative performance optimization.
The Beautiful but “Flawed” Artist: Tracy
Tracy is like a highly skilled and flamboyant artist. It’s an instrumentation and sampling profiler with an incredibly powerful UI that supports remote profiling and has an overwhelming number of features.
Theoretically, you could use it for very detailed performance dissection of a long-running program. But reality is harsh. On the Apple Silicon stage, this artist has forgotten half of its moves—its call-stack sampling feature is missing here.
This means you can still use its powerful instrumentation features (by manually adding probes in your code), but you won’t get that automatic, big-picture stack information. This makes the integration process on macOS quite tedious. You’ll need to modify your build.zig, and manually add Tracy’s client library and various macros to your code.
In a nutshell: If you need pixel-perfect manual instrumentation and don’t mind a complex setup, Tracy is still a decent choice. But for most scenarios, its limitations on Apple Silicon are a major drawback.
The Official “Old-Timer”: Apple Instruments
Finally, let’s talk about Apple’s own creation: Instruments.
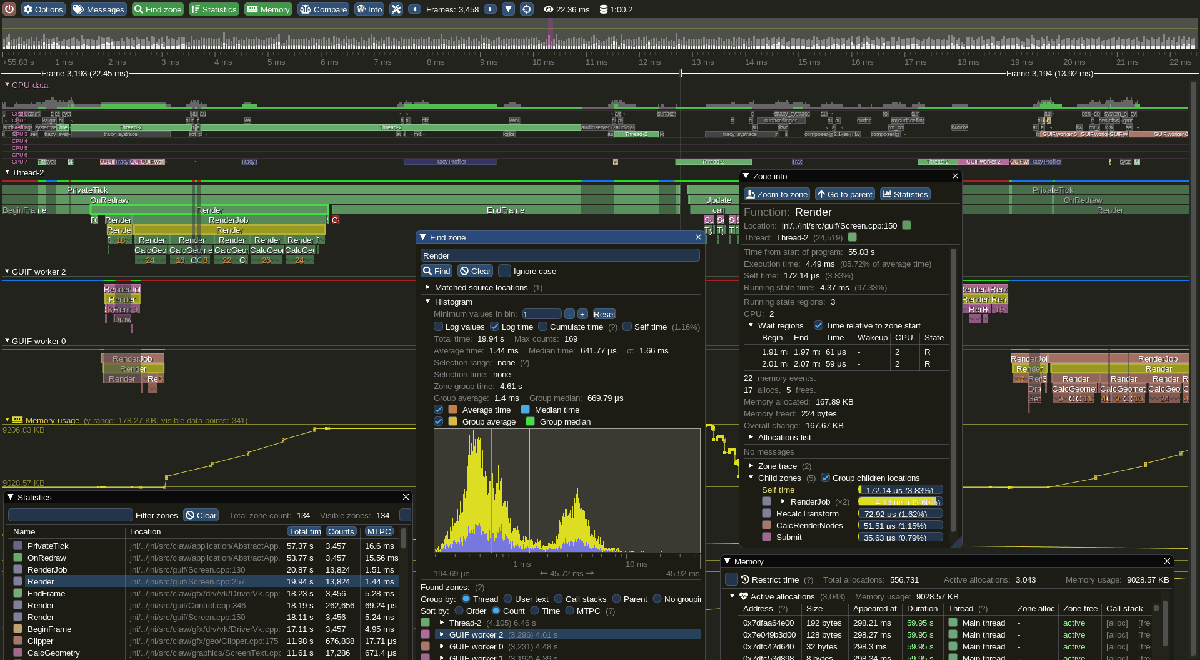
As the official tool, its power is unquestionable. CPU analysis, hardware counters, GPU usage, network traffic… it can do almost everything. The jobs that samply and poop do, Instruments can basically do them all, and more.
But it has a glaring problem: It’s SLOW!
A tool meant for performance analysis having performance issues itself is a joke that could make me laugh all day. Its UI and the entire application feel heavy, and both launching and exporting data are painfully slow. In the original author’s words, a program that runs in 4 seconds took 40 seconds to run 3 times and export an XML with Instruments!
In a nutshell: It’s your last resort. Only when other tools can’t meet your demanding needs should you bring out this powerful but sluggish old master.
Conclusion: Survive the Desert by Choosing the Right Tool
Alright, folks, you have the treasure map. Although the Zig performance analysis ecosystem on Apple Silicon isn’t as rich as on Linux, we are by no means helpless.
- Want a quick look? Go for Samply.
- Need to compare optimization effects precisely? Unleash poop.
- Want to monitor specific code sections with long-term instrumentation? Look into Tracy.
- Out of options? Be patient and open up Apple Instruments.
On this journey of exploration, we are all pioneers carving a new path.