Last week the ops guy dropped a monitoring screenshot in the chat—latency spiked from the usual 50ms straight to 500ms, and it was periodic. I checked: CPU normal, network normal, database no pressure. Turns out it was Go GC (garbage collector) doing periodic deep cleans causing the performance issue.
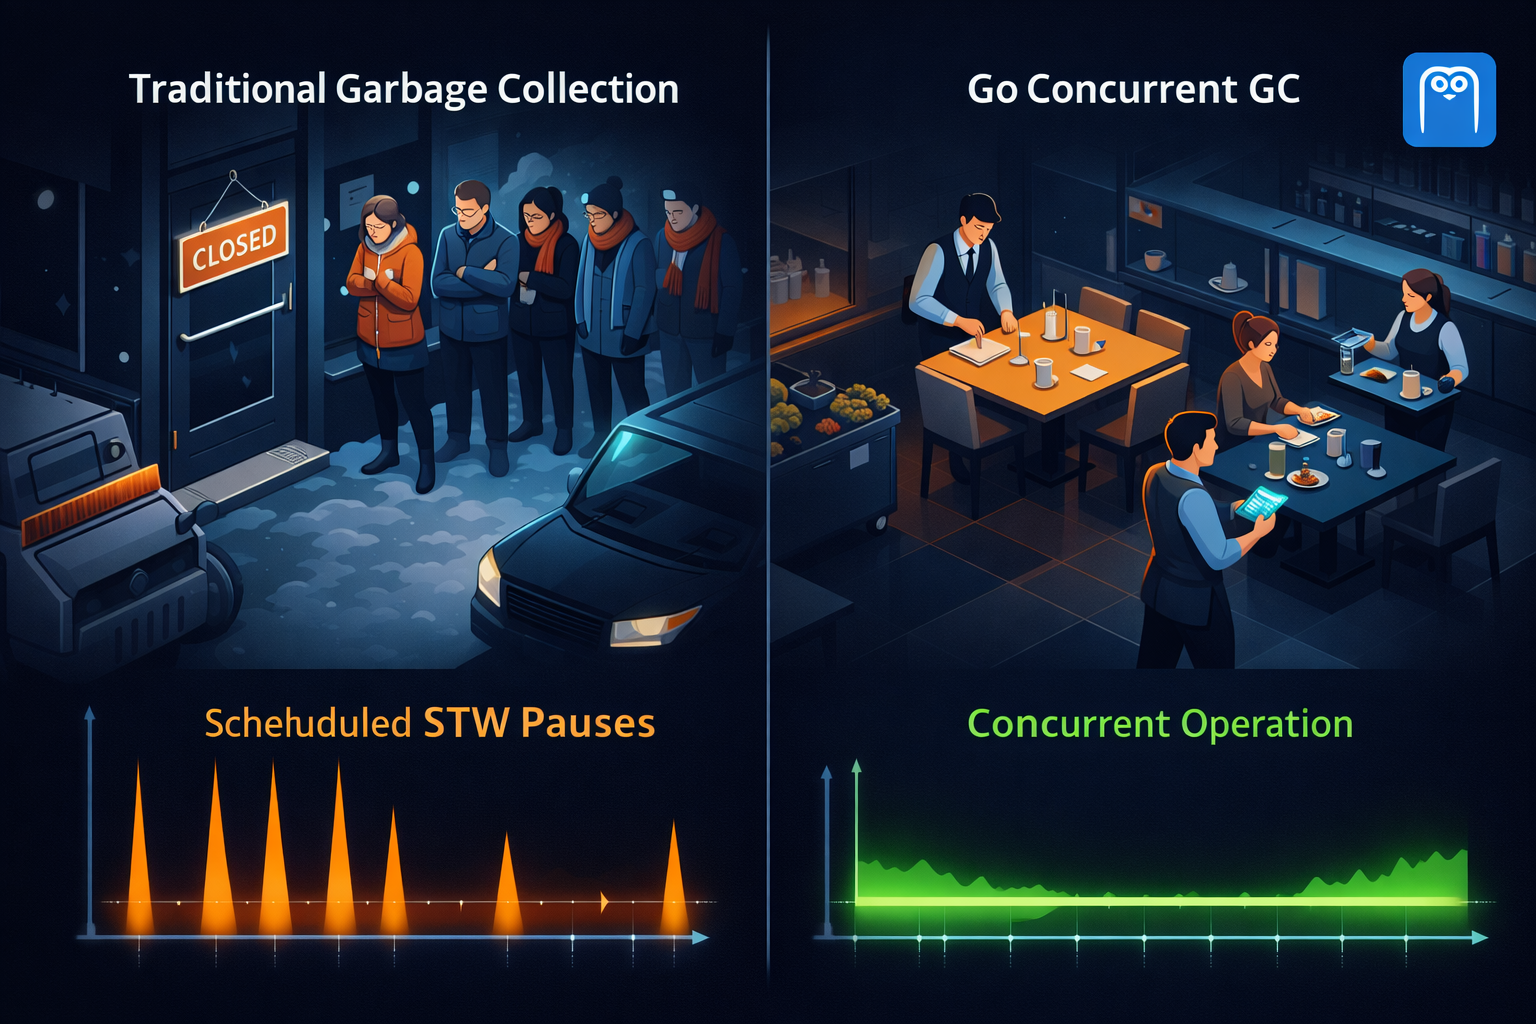
It’s like running a hotpot restaurant. When business is good, waiters can’t keep up with clearing tables—they can only do it all at once when customers are few. While they’re cleaning, new customers gotta wait outside, and the experience tanks. But Go’s concurrent garbage collection mechanism doesn’t work like that. It lets waiters serve new customers while clearing tables—customers barely notice the restaurant’s being cleaned. That’s the core secret of Go GC performance optimization.
Many programming languages’ garbage collection works like this: kick all customers out—aka Stop The World, or STW. Then waiters go crazy cleaning. Once done, they reopen. Customers just stand outside waiting. Go’s different—waiters serve new customers while clearing empty tables. That’s Concurrent Marking—GC threads and business threads run simultaneously without blocking each other.
But here’s the problem: waiters are cleaning while new customers keep coming in. How do they know which tables to clear and which are in use? Go GC uses something called the tri-color marking algorithm. This is the key technology for Go garbage collection performance optimization. Tables in the restaurant get three color tags: white means empty table ready to clear, gray means customer just left but haven’t checked for leftovers yet, black means table’s in use don’t touch. Waiters start checking gray tables—if there are leftovers it means someone’s still using it so mark it black, no leftovers mark it white ready to clear. Finally all white tables get cleared (memory reclaimed), black and gray tables keep serving customers.

There’s another hassle: a waiter’s checking a gray table when suddenly a customer sits down. If not recorded, this table might get mistakenly judged as empty and cleared—customer’s stuff would be lost. Go solves this with write barriers—every time someone sits down (object reference gets modified) it’s recorded in a notebook. When GC scans and sees the notebook records, it knows this table’s still in use and can’t be cleared. Although Go GC is concurrent, there are still two brief shutdown moments: at the start, post a notice saying “preparing to clean, don’t mess around” (set write barrier), at the end remove the notice saying “cleaning done, back to normal” (clear write barrier). These two moments combined usually only take tens of microseconds to a few milliseconds—customers barely notice.
Go GC also auto-adjusts the next trigger timing based on current memory usage. When business is booming and memory usage is high, GC cleans more frequently; when business is slow, GC relaxes. This behavior is controlled by the GOGC parameter, default value 100, meaning when heap memory grows to 2x the size after last GC, trigger next GC. Mastering GOGC tuning tricks is key to Go performance optimization.
Some Runnable Code

When starting your Go program, add GODEBUG=gctrace=1 to see detailed GC info:
GODEBUG=gctrace=1 ./your-app
Output looks like this:
gc 1 @0.017s 0%: 0.004+0.32+0.003 ms clock, 0.018+0.14/0.28/0.44+0.014 ms cpu, 4->4->3 MB, 5 MB goal, 4 P
Don’t panic, just look at a few key numbers. 0.004+0.32+0.003 ms means total pause of 0.34 milliseconds, including the two STWs and concurrent marking. 4->4->3 MB means 4MB before GC, 4MB during GC, 3MB after GC—so 1MB was reclaimed. 5 MB goal means next GC triggers at 5MB. If pause time spikes to tens or hundreds of milliseconds, gotta check what’s wrong.
Default GOGC=100 works for most scenarios, but sometimes you might wanna tweak it:
# Make GC more aggressive—more frequent but less each time
GOGC=50 ./your-app

# Make GC lazier—fewer triggers but more reclaimed each time
GOGC=200 ./your-app

# Completely disable auto GC—not recommended unless you know what you're doing
GOGC=off ./your-app
Quick rule: got enough memory and latency’s the bottleneck? Raise GOGC to like 200 to reduce GC frequency. Memory tight and often OOMing? Lower GOGC to like 50 to make GC more aggressive.
Want detailed GC performance data? Use Go’s built-in pprof:
import (
    "net/http"
    _ "net/http/pprof"
)

func main() {
    go func() {
        http.ListenAndServe("localhost:6060", nil)
    }()

    // Your business code
}
Then open in browser: http://localhost:6060/debug/pprof/heap, or use command line:
go tool pprof http://localhost:6060/debug/pprof/heap
In interactive mode, type top to see which functions use the most memory.
Production Pitfalls You’ll Hit
Restaurant keeps adding tables but customers don’t increase—waiters can’t keep up with cleaning. In this case GC frequency keeps increasing but memory usage won’t drop. Could be goroutine leaks, global variables holding large objects, or slice underlying arrays not released. Use pprof to find memory hogs, check if there are objects that shouldn’t live long-term.
Saw a project that set GOGC=500 to optimize performance, then memory usage spiked to several GB and OOMed. GOGC too large causes GC to trigger too late with too much memory backlog. Adjust GOGC based on actual memory capacity, don’t blindly increase it.
Go allocates large objects (over 32KB) directly to the heap, bypassing the normal memory pool. Frequently allocating large objects puts heavy pressure on GC and pause times become unstable. Can reuse large objects with sync.Pool, split large objects into smaller chunks, or use mmap and other ways to bypass GC.
Sometimes the service lags at a specific time. Could be scheduled tasks triggering allocation of tons of temp objects, cache expiration causing mass rebuilds triggering GC, or log rotation and data sync tasks all executing at once. Can stagger scheduled tasks, batch process data instead of loading everything at once, or use runtime.GC() to manually trigger GC during off-peak hours.
Go GC is concurrent—cleans while serving, pause time is extremely short usually a few milliseconds. Don’t mess with GOGC randomly, default 100 works, memory tight lower it, latency sensitive raise it. Use tools not guesses—gctrace for trends, pprof for problems. Don’t tune parameters by feel.
Here’s a cheat sheet:
# View GC details
GODEBUG=gctrace=1 ./your-app

# Adjust GC trigger timing
GOGC=200 ./your-app

# Start pprof
import _ "net/http/pprof"
http.ListenAndServe("localhost:6060", nil)

# Analyze memory usage
go tool pprof http://localhost:6060/debug/pprof/heap

# Manually trigger GC
runtime.GC()
What’s the most ridiculous GC problem you’ve hit in production? Memory leak causing the server to suicide restart at midnight, or GOGC set too large and ops chewed you out? Drop your war stories in the comments.
Common FAQ
Q: What’s the performance bottleneck in Go GC? A: Mainly STW time and large object allocation. Can significantly improve with GOGC tuning and sync.Pool.
Q: Does the tri-color marking algorithm affect concurrent performance? A: Nope. Go’s concurrent garbage collection mechanism is designed to minimize impact on business threads.
Q: What should GOGC parameter be set to? A: Default 100 works for most scenarios. Plenty of memory can go to 200, tight memory go to 50.
Q: How to monitor Go GC performance? A: Use GODEBUG=gctrace=1 to view GC details, use pprof to analyze memory usage.
Found this useful? If this article helped you understand how Go GC works or helped you dodge a pitfall, hit that like button so more folks hitting GC issues can see it, share it with your colleagues—especially those brave souls still using GOGC=off, follow Dream Beast Programming for upcoming practical topics like Go performance optimization and zero-downtime deployment, and drop a comment sharing your GC tuning experiences or questions.
Your support keeps me writing.