Ever had this feeling? You swear you drank three cups of coffee on Monday, but by Friday you can only recall “I think I had quite a bit.” Or you feel like you’ve been “staying up late lately,” but when pressed for specifics, you can’t name a single actual bedtime.
Human memory is unreliable. Great at spinning narratives, terrible at remembering numbers.
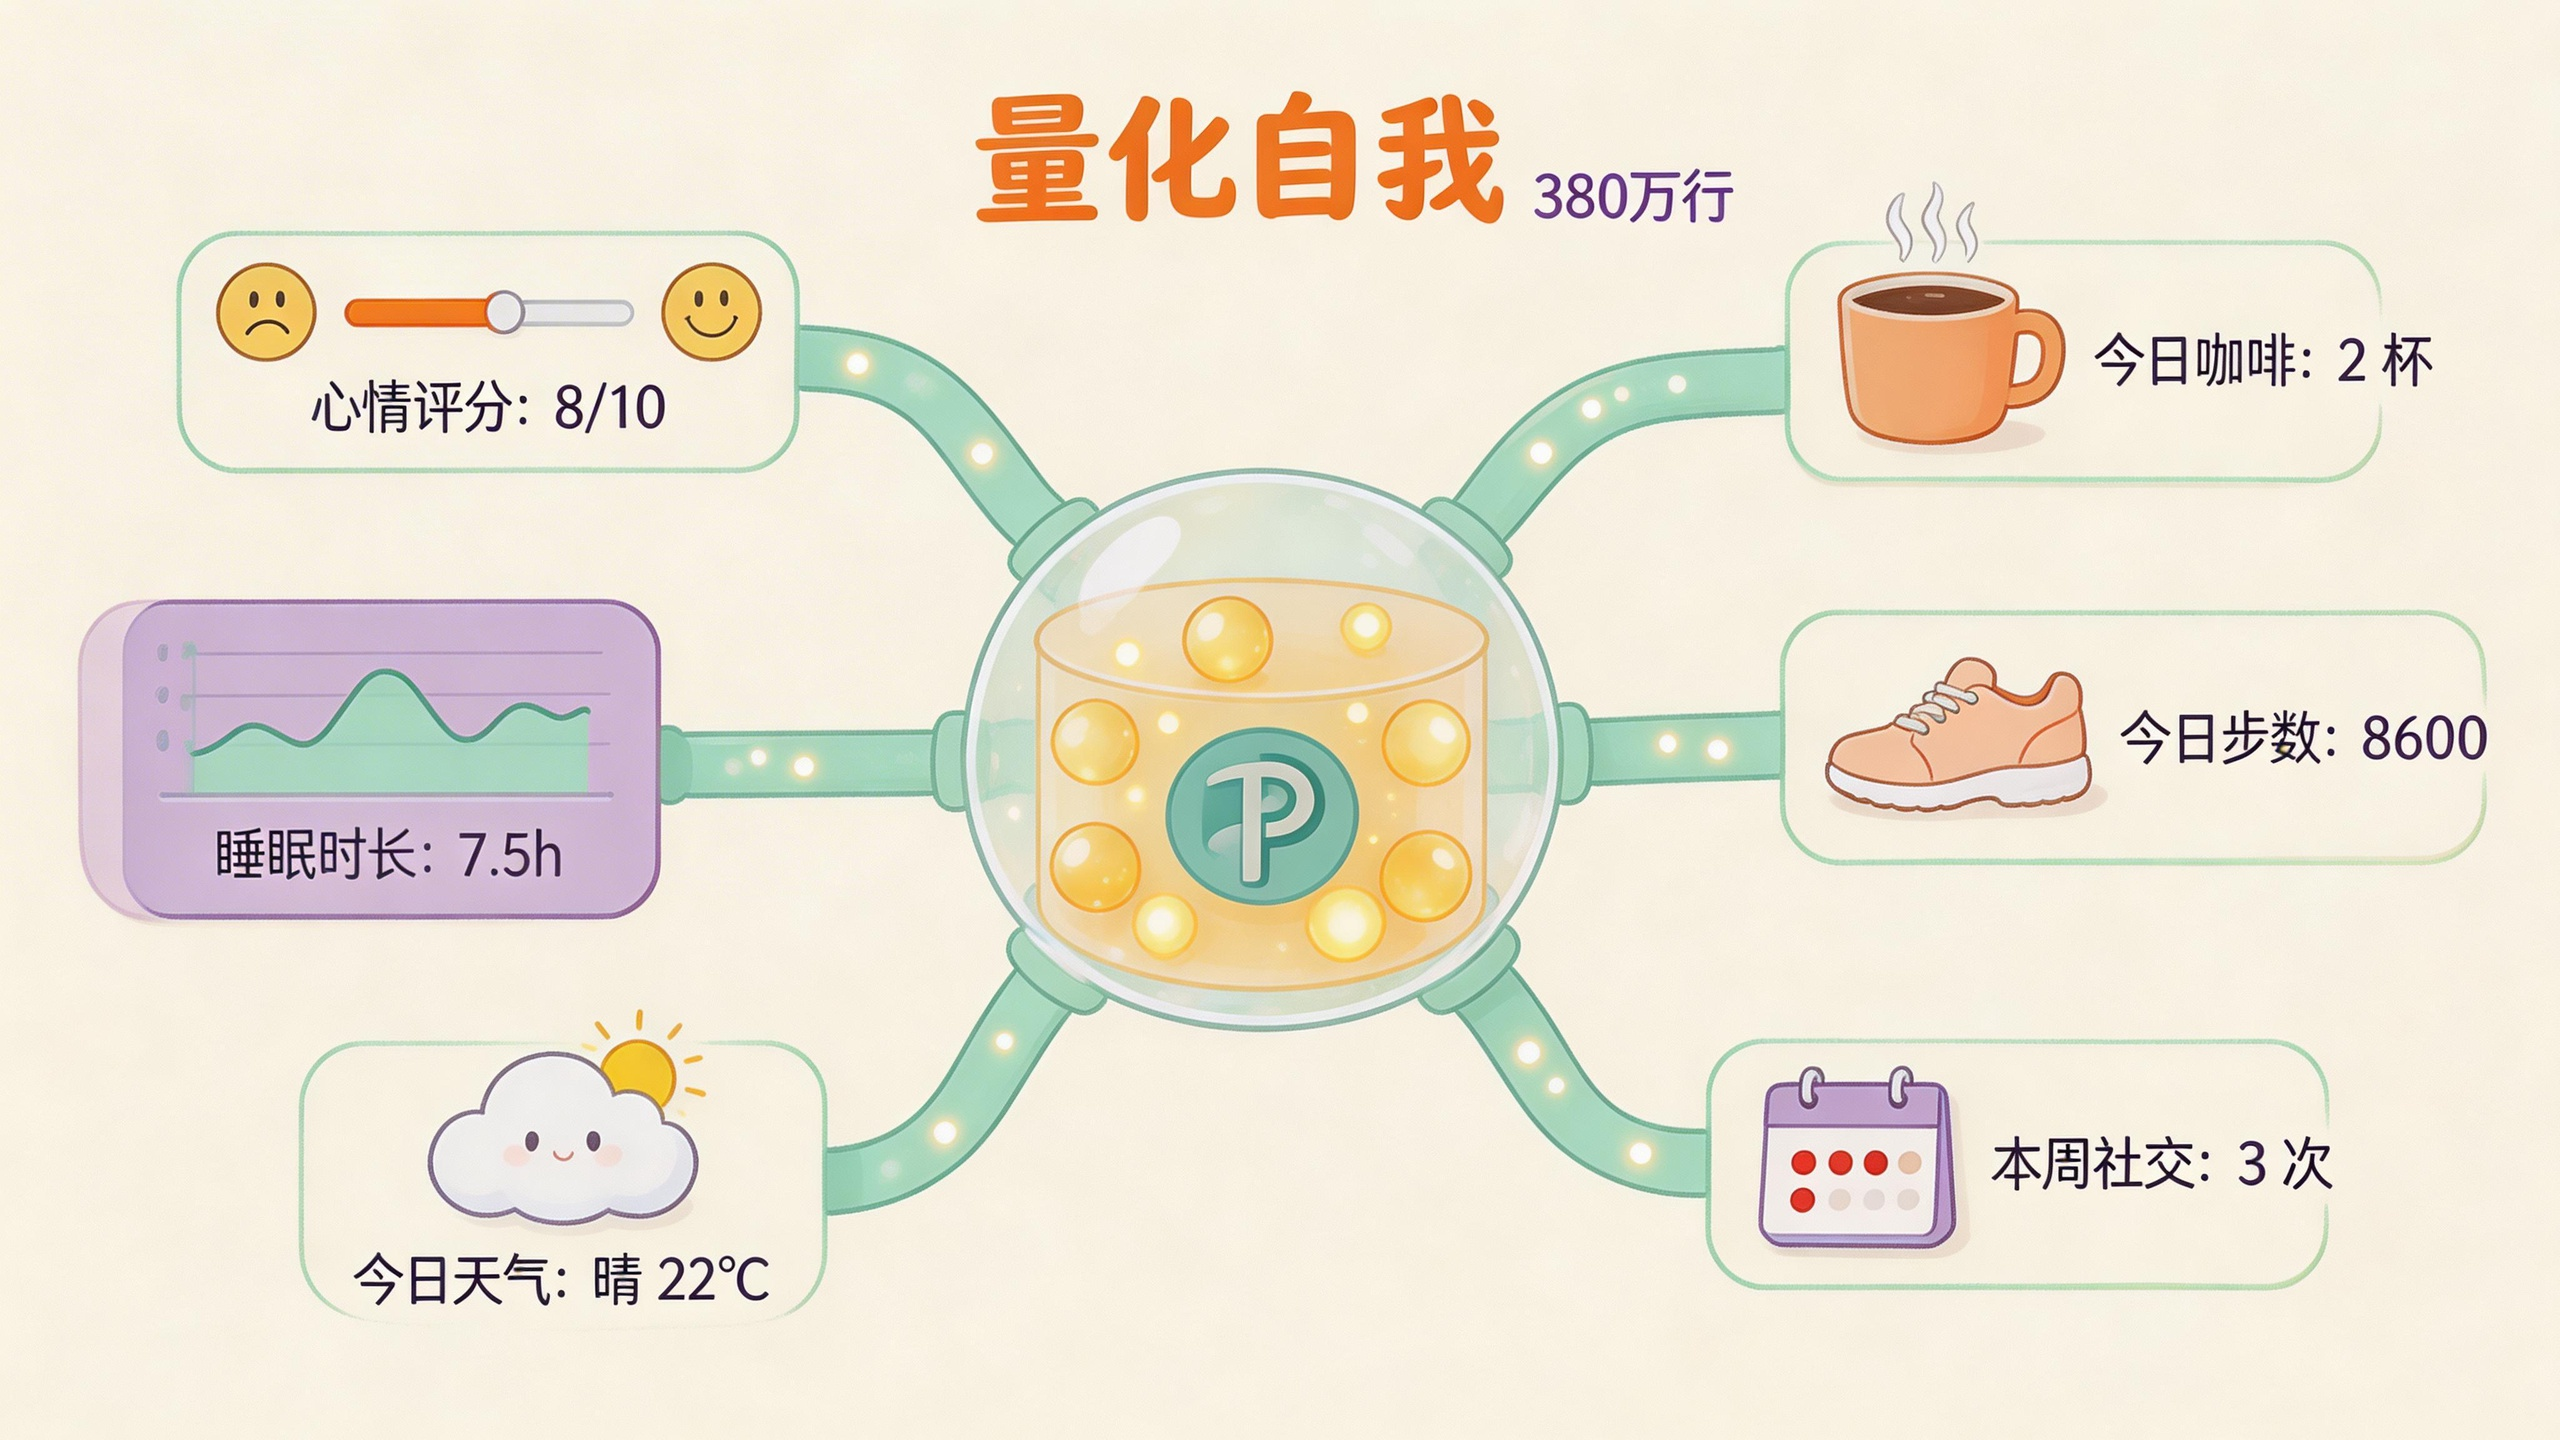
Felix Krause - yes, the Fastlane guy - did something even more extreme. He stuffed his entire life into a database. Three years later, he’d accumulated 380,000 records across 48 visualization charts, all open-sourced on GitHub.
This isn’t some geek’s OCD kicking in. It’s a hardcore experiment in self-knowledge.
What Does “Me” Look Like in a Database?
Felix’s project is called FxLifeSheet. Sounds like some financial product, but it’s actually a Quantified Self system.
What’s Quantified Self? Simply put: recording your life with data.
How many steps did you walk today? Apple Health knows. How long have you been sitting at your computer? RescueTime knows. Where have you been? Foursquare Swarm knows. What’s the weather like? Weather API knows.
What Felix did was move all this scattered data into a single Postgres database, then added manually-tracked items: mood, coffee intake, social activities, reading time, and more.
The result? 3.8 million rows of data.
Here’s some perspective: if you wrote a 1,000-word diary every day from birth until age 80, you’d have about 29 million words. These 3.8 million rows of data, converted to text volume, roughly equals documenting your life twice over.
What Data Does Quantified Self Track?
Looking at this “life checklist,” you’ll realize Felix took “quantification” to an obsessive level.
Automatically tracked data:
- Computer usage time (RescueTime auto-logging)
- Location (Foursquare Swarm check-ins)
- Weather (daily API fetch)
- Health data (Apple Health sync)
Manually tracked data:
- Daily mood rating (1-5 scale)
- Coffee intake
- Sleep quality and duration
- Exercise type and intensity
- Social activities (meeting friends, attending events)
- Reading time
- Meditation time
- Illness status
- …and 90+ more items
He even tracked every moment when he felt “particularly accomplished today.”
This isn’t diary-keeping. This is installing a surveillance camera on your life.
What Do 48 Charts Tell You?
With data in hand, the next step is making it “speak.” Felix built a visualization system using Ruby + JavaScript + Plotly, generating 48 charts.
These charts can answer questions you never dared ask yourself:
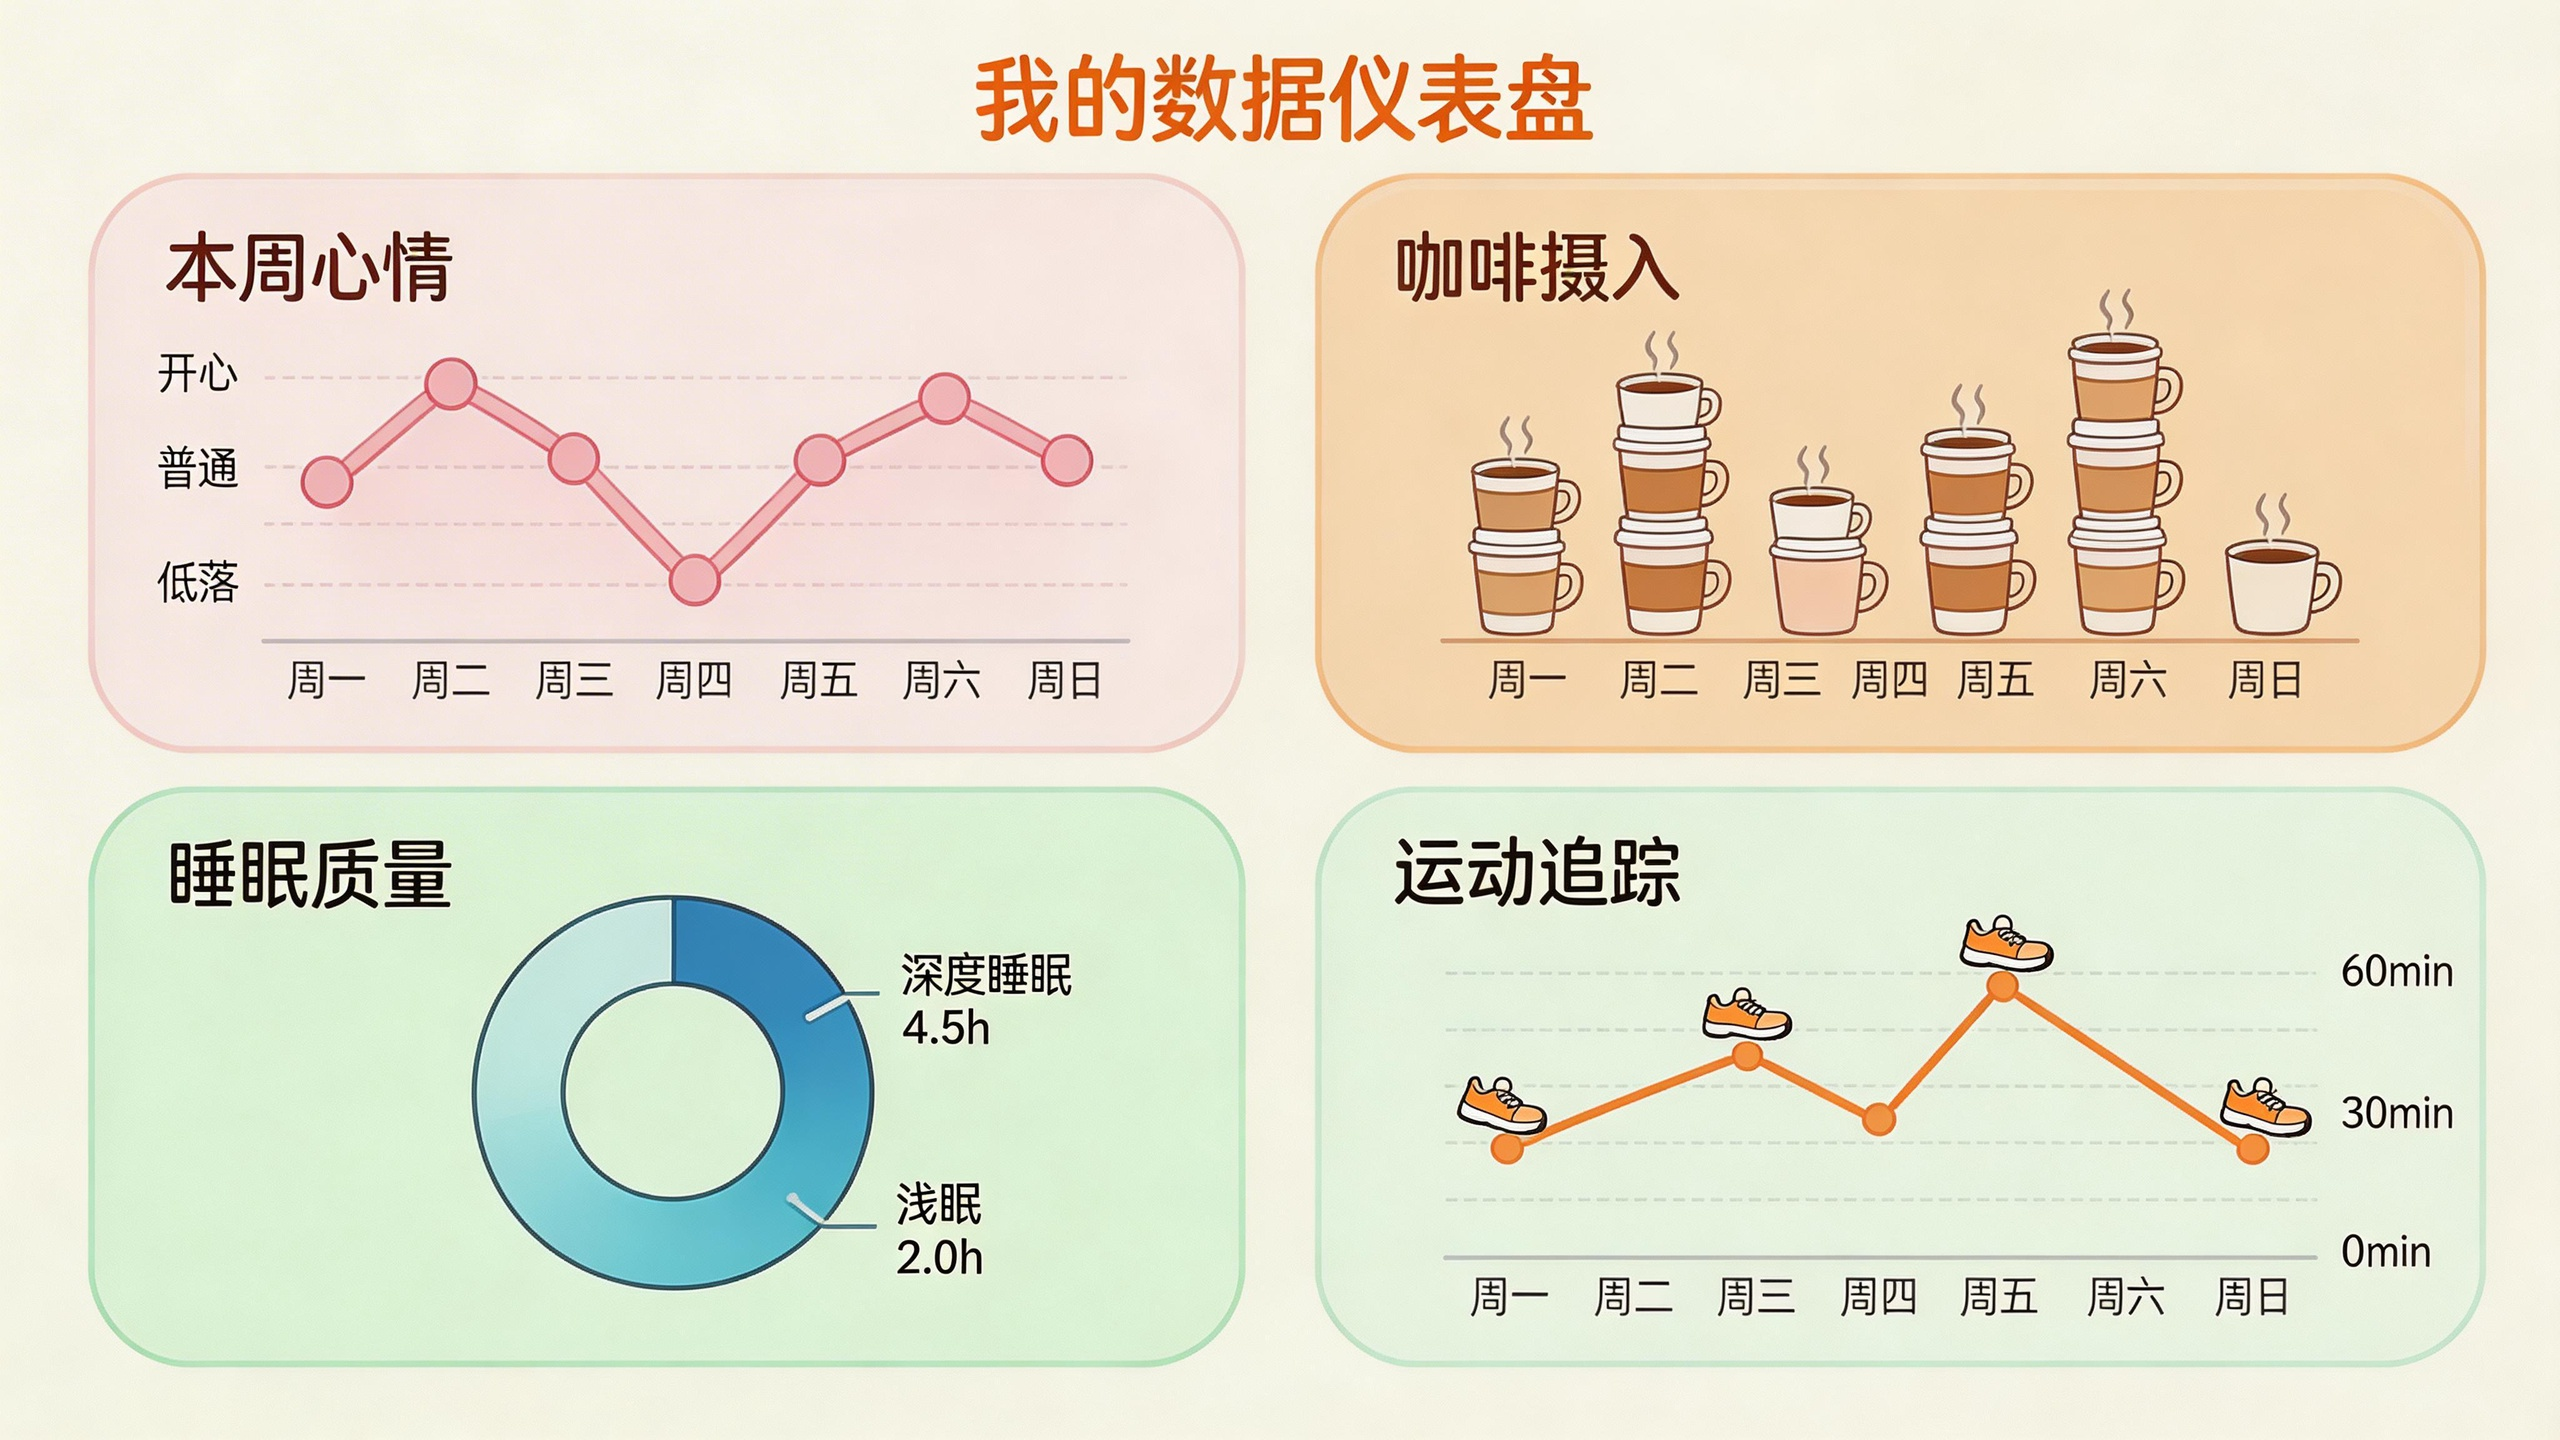
“When am I in the best mood?” Not weekends, not payday. The data shows Felix’s highest mood scores typically appeared in afternoons after outdoor exercise. The exercise + sunshine combo beats any “self-improvement” hack.
“Does coffee really make me more alert?” The data says not necessarily. Felix found almost zero correlation between coffee intake and work productivity. Sometimes he felt sleepier after coffee - probably caffeine tolerance at work.
“Does weather affect my social life?” Yes. On sunny days, Felix’s social activities were 40% higher than on rainy days. Humans really are photosynthetic creatures.
“How long have I actually been sitting at this computer?” Average 8.6 hours daily. The record was 14 hours. Seeing this number, Felix said he was “startled.”
What’s the point of these discoveries?
The point is: these are facts, not feelings.
“I feel like I’ve been staying up late lately” hits differently from “data shows your average sleep time decreased 23% this past week.” Data doesn’t lie, and it doesn’t make excuses for itself.
FxLifeSheet Tech Stack Breakdown
You might think building such a system must be complicated?
Actually, Felix’s tech choices were quite modest:
- Database: PostgreSQL (relational database, stable and reliable)
- Backend: Ruby (various API fetching scripts)
- Frontend Visualization: JavaScript + Plotly (charting library)
- Data Collection: RescueTime, Foursquare, Apple Health APIs, plus manual entry
The project’s codebase isn’t huge. The core challenge lies in data cleaning and standardization.
For instance, RescueTime uses UTC time, Apple Health uses local time, and weather APIs return Unix timestamps. Aligning all this data to the same timeline requires plenty of grunt work.
Another example: how do you define “social activity”? Does meeting friends count? What about attending offline events? Running into an acquaintance at a coffee shop? These all need clear definitions during data entry, otherwise later analysis becomes garbage in, garbage out.
The Significance of Open Source
FxLifeSheet is open-sourced on GitHub under the MIT license. Felix isn’t showing off - he wants to tell everyone:
You can do this too.
The repository contains complete database schemas, data collection scripts, and visualization code. You only need to do three things:
- Set up a Postgres database
- Apply for various API keys (RescueTime, Foursquare, etc.)
- Spend 5 minutes daily manually recording some data
Three months later, you’ll have your own life dashboard.
Of course, Felix also warned about some pitfalls:
- Data entry friction: The more complex manual tracking becomes, the easier it is to give up. He suggests only tracking indicators you truly care about
- Privacy concerns: If this data leaks, it’s more dangerous than your ID number. Take security seriously
- Analysis paralysis: Having data doesn’t mean you’ll reach conclusions. Over-analyzing can actually cause anxiety
Quantified Self, Then What?
Back to the original question: why do this?
Felix wrote in the project README:
I’m not tracking for the sake of tracking. I want to understand my behavioral patterns, then make changes.
Data is just a tool. Action is the goal.
Knowing “exercise improves my mood,” he forces himself to go for a run when feeling down. Knowing “coffee doesn’t really affect my productivity,” he started trying to reduce coffee intake.
The purpose of Quantified Self isn’t to turn life into an Excel spreadsheet - it’s upgrading from “I feel” to “I know.”
Human intuition evolved as a “quick reaction mode,” designed for responding to lion attacks, not for answering questions like “why have I been so tired lately” that require long-term observation.
The database is that “external memory” recording everything for you. It doesn’t get tired, doesn’t forget, and doesn’t tamper with data based on mood.
Do You Need This System?
Honestly, Quantified Self isn’t for everyone.
If you can’t even stick to expense tracking, you probably won’t stick to daily mood and sleep logging either. The problem isn’t willpower - it’s that this activity itself doesn’t hold enough value for you.
But if you’ve ever had these confusions:
- “I always feel like there’s not enough time, but I don’t know where it goes”
- “I want to improve my sleep, but I don’t know what’s actually affecting it”
- “I want to know how much exercise really helps my mood”
Then a system like FxLifeSheet might be worth trying.
Start simple: track just one thing. Like daily mood rating, or daily sleep duration. Stick with it for a month and see what the data tells you.
You might be surprised to discover that the “always staying up late version of yourself” only actually stayed up late 30% of the time. Or that the “never exercises version of yourself” actually walks every week - you just didn’t count strolling as exercise.
Data sometimes overturns your self-perception. That’s precisely where its greatest value lies.
FAQ
Q: How much technical background does this system require? A: Basic database operations and simple programming knowledge are enough. If you can query data with SQL and write some Python or Ruby scripts, you can run it. Felix’s code comments are detailed - just follow along and modify the configuration.
Q: How is data privacy ensured? A: All data is stored in your own database, not dependent on any cloud service. As long as your server is secure, your data is secure. Of course, this also means you’re responsible for your own backups.
Q: What if manual tracking is too troublesome? A: You can track only automatically-collected data. RescueTime and Apple Health don’t require manual operation. For manual tracking, start with 3-5 daily indicators, then add more once the habit forms.
Q: Does data analysis require a statistics background? A: Being able to read basic charts is sufficient. Felix’s visualization system is already built - you just need to interpret the results. If you want deeper analysis (like correlation testing), you might need to learn some basics.
Q: Is this project still maintained? A: As of early 2026, FxLifeSheet is still actively maintained on GitHub. Felix periodically updates documentation and code. Project URL: github.com/KrauseFx/FxLifeSheet